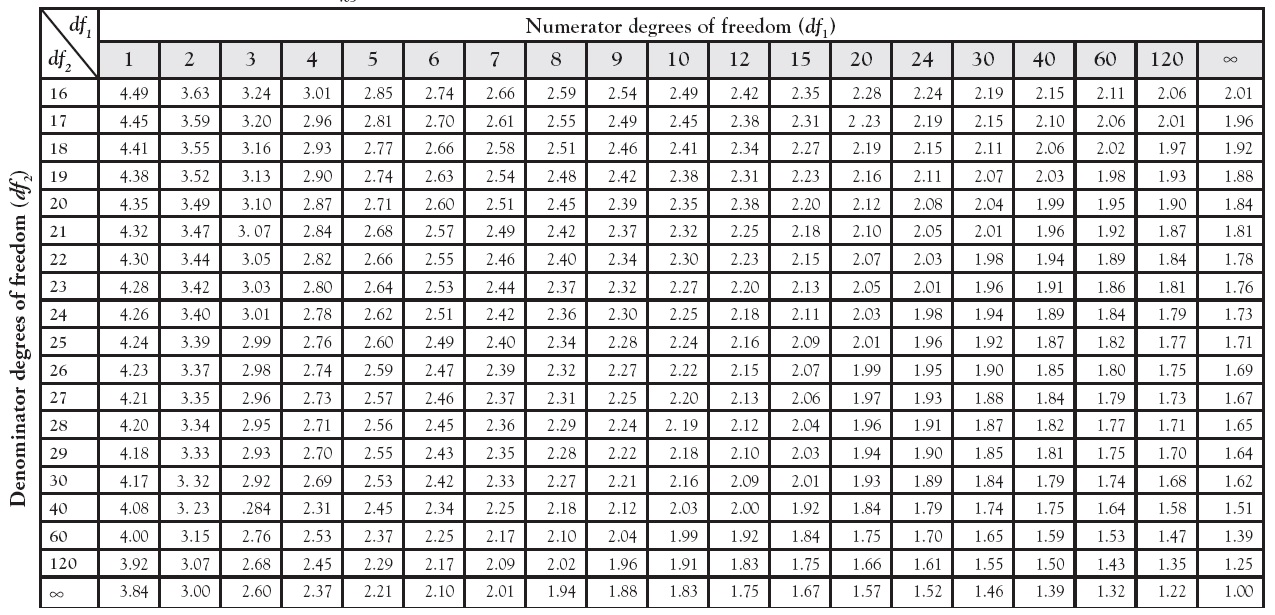
Table A1. An F table: Values of F.05
Table A2. A t-table: Values of tγ
Table A3. Percentage points of the studentized range
Table A4. Percentage points for Dunnett’s test: dα(p – 1, n – p) where α = .05
Table A1. An F table: Values of F.05


Source: M. Merrington and C. M. Thompson, “Tables of Percentage Points of the Inverted Beta (F)-Distribution,” Biometrika 33 (1943), pp. 73–88. Reproduced by permission of the Biometrika Trustees.
Table A2. A t-table: Values of tγ
Source: From “Table of Percentage Points ...
Get Experimental Design now with the O’Reilly learning platform.
O’Reilly members experience books, live events, courses curated by job role, and more from O’Reilly and nearly 200 top publishers.

