Raw data becomes valuable and impactful when it is transformed into meaningful insights that help us understand the past and predict the future. Data visualization is a fusion of technology, scientific, and experience design disciplines that make it possible to process monumental quantities of data very quickly, and present in a compact, beautiful easy to engage visual format.
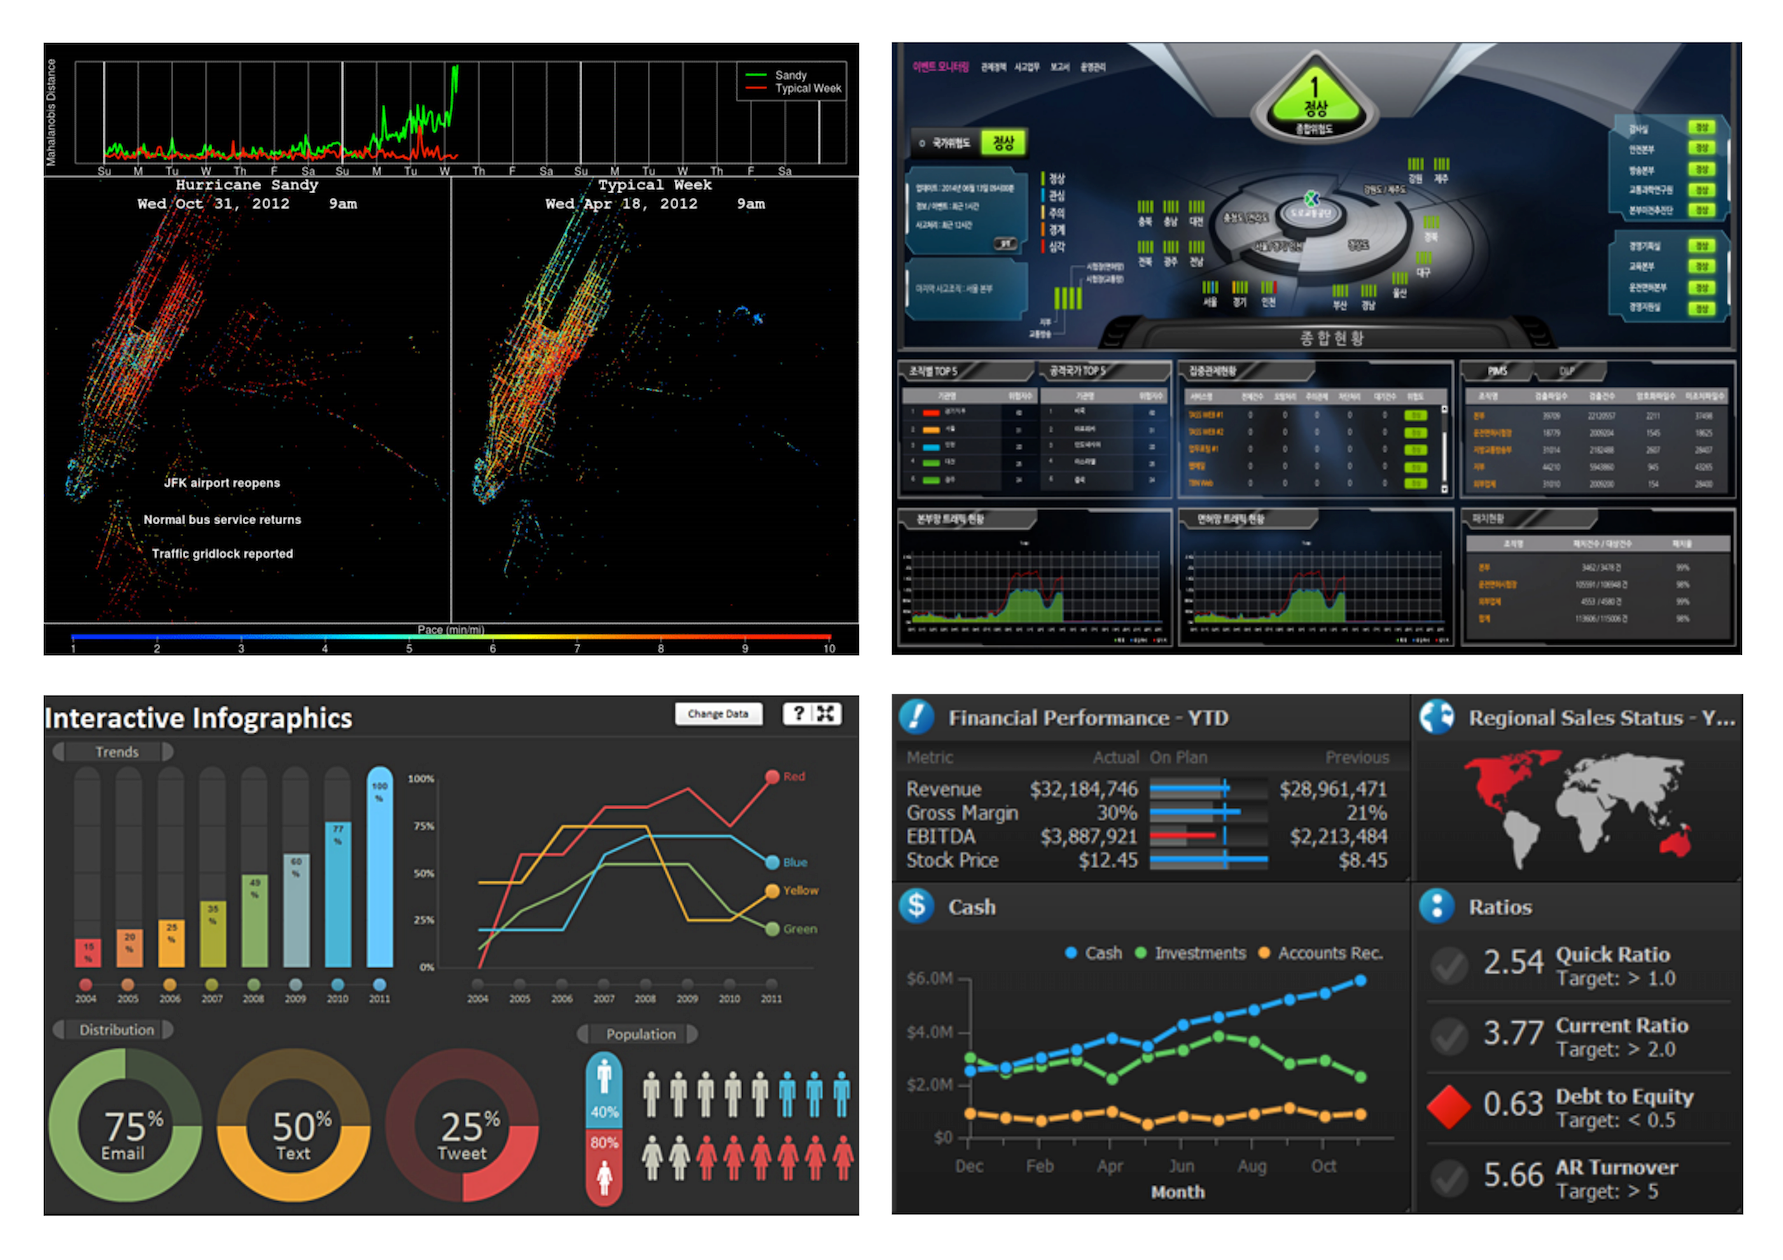
The preceding image contains visualization samples of scientific, financial, and population data dashboards. Each of the panels is an engaging interactive representation of information--massive datasets are expressed as charts, graphs, maps, and graphics. ...

