A.1. Chapter 1—Extreme Toyota
Figure 11.3. Total revenues (1997 to 2006) of the five largest car manufacturers.

Figures are for the fi scal years ending in March.
Source: Revenue fi gures for 1997 to 2006 from Thomson One Banker Analytics, May 6, 2007.
Figure 11.4. Automotive segment revenues and regional distribution of the 10 largest car manufacturers in 2006.

a Figures are for the fi scal year ending in March.
b Africa is included in Asia-Pacifi c.
Source: Author analysis of company annual reports and 2007 Global Market Data Book (New York: Automotive News, 2007).
Figure 11.5. Toyota's net income (1997 to 2006) compared to its peer group average.
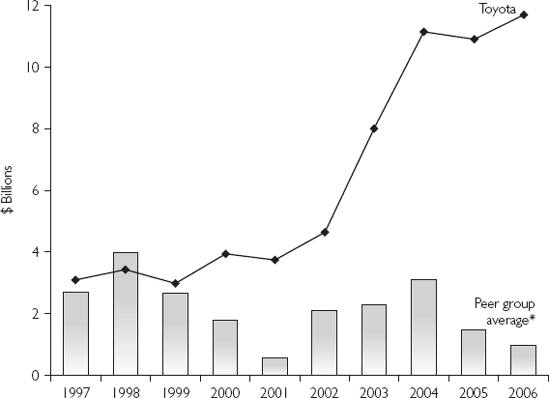
Peer group includes DaimlerChrysler, Ford, General Motors, Honda, Hyundai-Kia, Nissan, Peugeot-Citroen, Renault, and VW Group.
Source: Net income fi gures for 1997 to 2006 from Thomson One Banker Analytics, May 6, 2007.
Figure 11.6. Toyota's operating profit margin (1997 to 2006) compared to its peer group average.
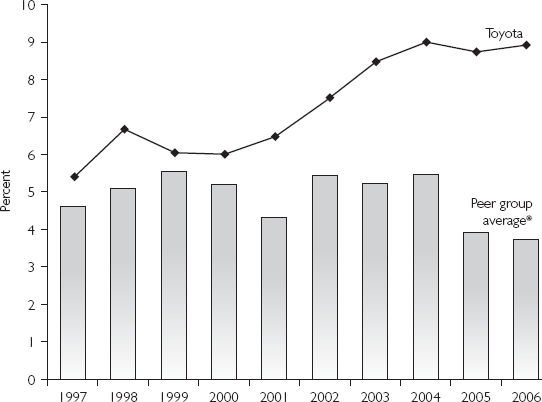
Peer group includes DaimlerChrysler, Ford, General Motors, Honda, Hyundai-Kia, Nissan, Peugeot-Citroen, Renault, and ...
Get Extreme Toyota: Radical Contradictions That Drive Success at the World's Best Manufacturer now with the O’Reilly learning platform.
O’Reilly members experience books, live events, courses curated by job role, and more from O’Reilly and nearly 200 top publishers.

