Chapter 4. Principle 3: Monitor Your Applications Running on Linux Across the Entire Stack
Monitoring Linux servers in the cloud is vastly different from traditional monitoring. Cloud monitoring goes far beyond the monitoring of servers. You must not only monitor server performance metrics, such as the standard CPU, memory, I/O, and network performance, but also several other things. Application performance monitoring is at least, as important, if not more so, than server monitoring.
In modern environments, you must also monitor website performance, containers (which are increasingly prevalent in the cloud), and microservices. Monitoring the cloud involves monitoring of various types of cloud servers, beyond the servers that you host in AWS or Azure, or a different cloud platform. Here’s a summary of the types of cloud services you may be monitoring in the cloud:
Servers hosted by a cloud provider, such as Azure or AWS
Serverless functions, like Azure Functions or AWS Lambda
Cloud-based SaaS services, such as Office 365, Salesforce, or Adobe Creative Cloud
Application-hosting services, like Azure App Service, Google Compute Engine, or Heroku
Application Performance Monitoring (APM) and the Cloud
Traditional IT monitoring is focused on monitoring the computing environment—servers, storage, and networks, among other pieces. However, most cloud deployments don’t require you to perform these standard monitoring functions. The cloud provider monitors and manages the infrastructure that you’re renting, so you don’t need to worry about typical IT infrastructure issues, such as servers that crash, disks that fail, and networks that drop packets. All these traditional concerns are gone.
You may not even have any servers or other infrastructure when you are using a cloud environment. For example, you may use a service, such as Azure App Service, to deploy your applications to the cloud. And you may rely on Azure SQL databases and a hosted caching service, such as Redis.
Serverless computing (Azure Functions and AWS Lambda) is a relatively new phenomenon that promises to grow in importance. Serverless architectures help developers deploy applications as chunks of business logic. The cloud provider spins up the necessary computing infrastructure to process the requests for the functions. And it requires no servers at all, because the deployment unit is just code! You don’t need to worry about provisioning the servers for running the functions, but you do need to know which requests are being heavily used and which requests are running slowly.
Monitoring your applications rather than your servers and other infrastructure components is key in a cloud environment. Application performance monitoring tools helps to monitor your end-user experience and to provide end-to-end visibility into your application stack. A good APM tool provides deep dive application component monitoring for your enterprise applications. It helps your development, middleware, database, and server experts to troubleshoot performance bottlenecks and to perform root-cause analysis across the cloud infrastructure.
APM tools replace guesswork and reduce your reliance on manual monitoring processes. They help managers understand how the IT services impact their business operations. By monitoring application performance end-to-end and providing insights into capacity utilization, they enable businesses to make sound decisions about resource allocation. They also help the IT groups monitor how well the applications are meeting their SLAs, thus ensuring a good end-user experience.
Challenges of Monitoring Hybrid Architectures
Multicloud architectures are increasingly popular. The “RightScale 2018 State of the Cloud Report” finds that 81% of respondents have a multicloud strategy. Although enterprises still pursue hybrid cloud strategies (by combining public and private clouds), a clear majority of enterprises have a multicloud strategy.
There are several monitoring related issues that crop up in a multiple cloud and hybrid cloud architecture:
- Multiple tools
A wide assortment of tools adds to administrative overload.
- Lack of visibility into resource utilization
Cloud workloads change often and require you to forecast capacity to determine when you need more server resources.
- Dynamic resource provision
When supporting a dynamic environment, where the number of instances could vary according to changing workloads, monitoring every application and every server isn’t a trivial task.
Monitoring Linux VMs and Containers in the Cloud
Monitoring your Linux servers in the cloud offers visibility into the utilization, health, and performance of the applications and workloads that run on those servers. Monitoring helps you proactively fix issues before your users get impacted.
Log Analysis
Collecting and analyzing your systems and application data can offer insights into your cloud infrastructure. Efficient log analysis helps you gain operational insights, with minimal time spent looking for anomalies across the cloud environment.
Linux Server Monitoring
Linux server monitoring helps give you visibility into your cloud deployments. Monitoring in the cloud certain capabilities, including:
Monitor operational health, and trigger alarms when specified conditions are met.
Provide application diagnostics.
Provide diagnostic data to aid in troubleshooting.
Provide resource utilization statistics.
Offer a window into application performance.
Monitoring and Tracking API Calls
Most cloud services are offered as APIs, and thus, it’s important to track API calls for various services. An API tracking tool, such as AWS CloudTrail, helps with troubleshooting operational issues, supporting security analysis, and contributing to your compliance efforts. AWS CloudTrail can do the following:
Detect usage behavior patterns by tracking APIs.
Track the creation, deletion, and modification of cloud resources, such as VMs, security groups, and storage volumes.
Identify the most recent changes made to resources in the organization’s cloud account.
Cloud Performance Monitoring
Organizations often use multiple cloud providers. A multicloud application contains a number of components, with workflows that travel through different cloud providers. All cloud providers offer tools for performance monitoring, but the tools vary in their features and focus.
Performance Benchmarks
To measure system performance effectively, you must compare performance metrics against valid performance benchmarks. Without this comparison, it’s hard for you to tell how current performance compares to the benchmarks, and you won’t be able to gauge the severity of potential issues.
Key Linux Server Metrics to Monitor
Monitoring VMs tells you which are overutilized or underutilized. You can then increase or decrease the number of virtual instances or resize the instances to match your workload requirements.
There are basic VM level metrics you must monitor in the cloud to ensure that your servers and services are functioning efficiently. The four most common server metrics to monitor are:
CPU usage
Disk I/O
Memory utilization
Network performance
CPU metrics
CPU usage has traditionally been the most common performance metric when monitoring Linux servers. You need to receive alerts when server CPUs are reaching their saturation point. The key statistic to watch is the percentage of time the CPU is in use. The raw CPU percentage doesn’t tell the whole story—you want to dig deeper and find out what percentage of CPU usage is for running user applications (CPU user time) and what percentage is being used by the system (CPU privileged time).
I/O performance
Disk read and write metrics help you identify I/O bottlenecks. Cloud providers offer multiple instance types, with each one optimized for specific types of workloads. Some instance types are meant for high I/O-based workloads, and others, for heavy CPU usage-related applications.
If you’re running applications that involve high amounts of writes and you notice I/O bottlenecks, you can switch to a different instance type that offers a higher number of input/output operations per second (IOPS).
Memory utilization
Monitoring memory usage is a crucial component of monitoring VMs in the cloud. A low memory condition adversely impacts application performance. Monitoring reveals the amount of used and free memory for the instances. Paging events occur when an application requests pages not available in memory.
In low memory situations, pages are written to disk to free up working memory. The application must then retrieve the page from memory. An excessive amount of paging drastically slows down an application. Spikes in paging indicate that the VM is unable to cope with the requests from the application.
Network performance
Network monitoring shows the rate at which network traffic is flowing in and out of a VM. Network metrics are shown in the statistic bytes per second (bytes received per second and bytes sent per second), indicating the volume of network traffic.
Getting a Unified View of Your Infrastructure
The special nature of cloud environments, especially multicloud and hybrid cloud environments, makes traditional on-premise Linux performance tools inadequate. Well-known Linux open source monitoring utilities, such as vmstat, iostat, top, and sar aren’t enough to monitor your servers, because of the dynamic nature of server provision and the inability of these and similar tools to provide you an enterprise-wide, unified view of your cloud infrastructure.
Although cloud providers provide proprietary tools to help you monitor the cloud infrastructure, it may be a good idea to add a third-party tool, such as Datadog, to enhance your performance-monitoring capabilities in the cloud. You can integrate Datadog with Azure. Datadog helps you collect and view infrastructure-wide metrics. It helps you correlate the VM metrics with application-level metrics.
Datadog also helps you collect more metrics than you can access in the Azure portal. You can even integrate third-party tools, such as Datadog, with other third-party tools, such as PagerDuty and Slack, to get automatic alerts. A big benefit of using third-party monitoring tools like Datadog is that they help you add metrics from multiple systems to performance dashboards, thus providing you a comprehensive view of your entire infrastructure, regardless of where the components live.
Note
Serverless architectures, such as Azure Functions and AWS Lambda, use code as the deployment unit.
As mentioned earlier in this chapter, most enterprises (81%) use multiple clouds and hybrid clouds, rather than a single cloud provider. Monitoring these types of architectures presents additional monitoring concerns, such as maintaining application performance as you move them from on premise to the public cloud, understanding application dependencies in each infrastructure, and analyzing the root causes of performance issues. I recommend looking at performance-monitoring tools, such as SolarWinds, to gain an end-to-end visibility of your applications running in hybrid clouds and multiple cloud environments.
Cloud-Monitoring Tools
Although organizations typically pour a lot of effort and money into application development, they don’t place a similar emphasis on cloud-monitoring tools. The truth is that, without the visibility and insight provided by powerful cloud-monitoring tools, you don’t know exactly how your applications are performing and therefore you don’t get the direction for improving the applications.
Cloud monitoring is a catchall phrase and includes a wide variety of tools. Service providers offer their own out-of-the-box monitoring tools, such as Amazon CloudWatch and Microsoft Azure Monitor. However, these tools may not be adequate for many cloud consumers, especially those with multicloud and hybrid cloud architectures.
Cloud-monitoring tools can be in-house tools offered by the cloud provider or tools offered by independent SaaS providers. Cloud monitoring is increasingly being offered as a fully managed on-demand service, with the service providing the tools for monitoring both cloud and on-premise infrastructures and web applications. The cloud monitoring is delivered through a SaaS-based software that tracks performance across the entire cloud stack. Cloud administrators and development teams can review the performance statistics in a central dashboard, and they can get alerts about performance issues through email, and SMS, among other options.
Cloud proprietary and third-party monitoring tools can also work well together. There are specific advantages in using the two types of tools. Cloud provider monitoring tools are preinstalled and preconfigured, so they’re ready to use, out of the box. SaaS monitoring tools have the advantage that they help monitor more than one type of cloud infrastructure, so they allow you to monitor all your applications and services from a single point.
New Relic, SolarWinds, and PagerDuty are some of the well-known cloud provider and third-party monitoring tools. All leading cloud providers offer built-in monitoring tools, as I explain in the following sections.
Amazon CloudWatch
Amazon CloudWatch us a tool offered by AWS that helps you monitor application metrics, log files, and react to changes in your AWS resources.
Google Stackdriver
Google Stackdriver offers monitoring and logging for applications that you run in the Google Cloud and in AWS. Although Stackdriver is natively integrated with Google Cloud Platform cloud products, it lets you aggregate data across cloud platforms.
Microsoft Azure Monitor
Azure Monitor is part of the overall Azure monitoring solution. Azure Monitor enables core monitoring for Azure services by allowing for the collection of metrics, activity logs, and diagnostic logs. It helps you track performance, maintain cloud security, and identify trends. In addition, Azure Advisor monitors resource configuration and usage telemetry and offers personalized recommendations based on best practices. Azure Application Insights help you to monitor the availability, performance, and usage of your cloud-based applications and to proactively identify and diagnose errors.
The Importance of a Comprehensive Monitoring Solution
An effective monitoring solution must help you do the following:
Understand the detailed operation of your infrastructure components.
Understand how your application components perform.
Enhance the availability of your applications with proactive notifications about critical issues.
Integrate with other tools to alert—and even fix—problems discovered by the monitoring.
No single tool can do everything in the monitoring space. You should integrate multiple monitoring services to deliver a comprehensive solution that helps you continuously assess the performance, availability, security, and health of your infrastructure and the applications that run on it. Figure 4-1 shows one such solution, offered by Microsoft Azure, in which multiple components work together to monitor Azure resources.
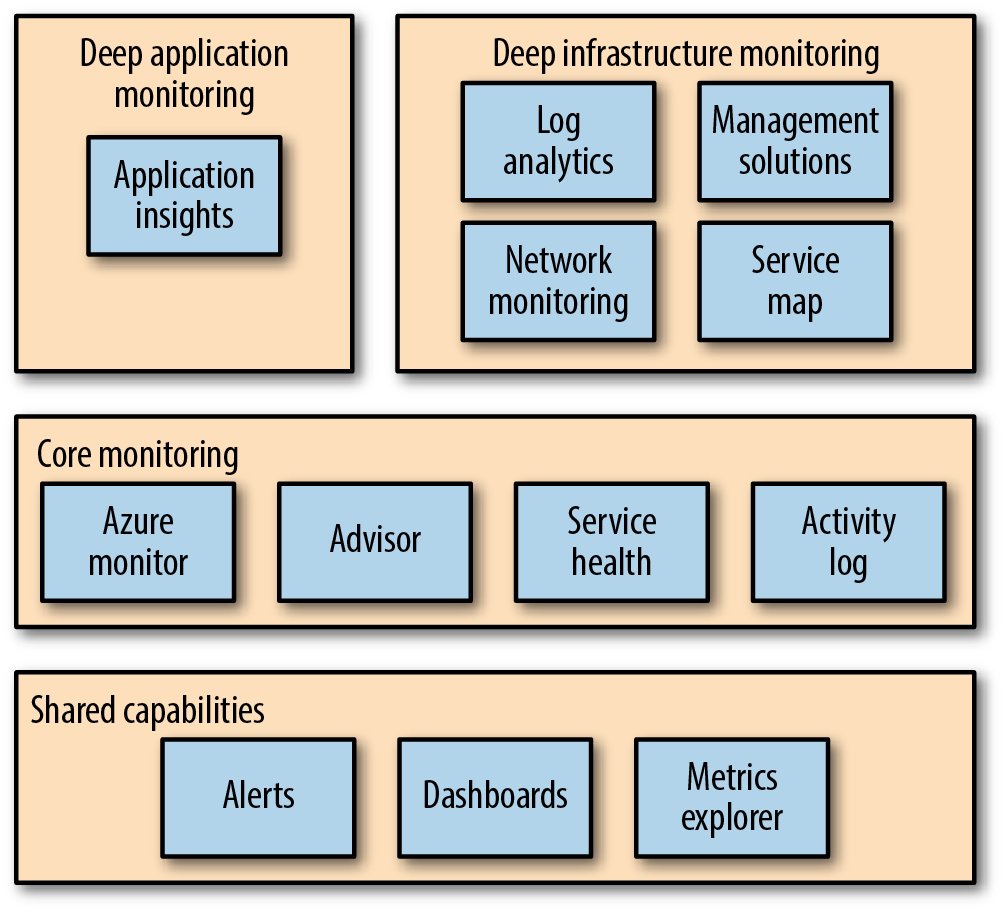
Figure 4-1. An example of a comprehensive monitoring solution
In a comprehensive monitoring solution, such as the one shown in Figure 4-1, the various services work together to collect, analyze, and act on telemetry from your cloud (and on-premise) infrastructure and the applications that you run on that infrastructure.
Best Practices for Cloud Monitoring
It’s a good idea to follow some basic guidelines when monitoring the cloud:
- Identify the right metrics
There’s no benefit in monitoring every activity in your cloud environment just because you can. You must monitor the key metrics that have a direct bearing on your goals.
- Support autoscaling
Autoscaling, which is the automatic adjustment of computing capacity to meet the changes in the cloud workloads, is a salient feature of cloud computing. The cloud-monitoring solution should be able to handle autoscaling, since it needs to monitor the continuously changing number of application instances.
- Monitor the user experience
The purpose of all your cloud activity is to provide a good user experience. By monitoring user-related performance metrics, such as response times, you can improve user experience.
- Gather uniform metrics
As mentioned earlier, many enterprises use a hybrid cloud environment, so they need to monitor both on-premise and cloud services. Uniform metrics help when displaying performance data from a variety of sources in a single location, such as a performance dashboard, providing you a comprehensive view of performance.
- Monitor cloud service usage and costs
A good monitoring solution should help you to track your resource usage in the cloud and to reduce costs.
Get Five Principles for Deploying and Managing Linux in the Cloud now with the O’Reilly learning platform.
O’Reilly members experience books, live events, courses curated by job role, and more from O’Reilly and nearly 200 top publishers.

