i
i
i
i
i
i
i
i
2 1
2 1
Erik Reinhard and Garrett Johnson
Color
Photons are the carriers of optical information. They propagate through media
taking on properties associated with waves. At surface boundaries they inter-
act with matter, behaving more as particles. They can also be absorbed by the
retina, where the information they carry is transcoded into electrical signals that
are subsequently processed by the brain. It is only there that a sensation of color
is generated.
As a consequence, the study of color in all its guises touches upon several
different fields: physics for the propagation of light through space; chemistry for
its interaction with matter; neuroscience and psychology for aspects relating to
perception and cognition of color (Reinhard et al., 2008).
In computer graphics, we traditionally take a simplified view of how light
propagates through space. Photons travel along straight paths until they hit a sur-
face boundary and are then reflected according to a reflection function of some
sort. A single photon will carry a certain amount of energy, which is represented
by its wavelength. Thus, a photon will have only one wavelength. The relation-
ship between its wavelength λ and the amount of energy it carries (ΔE)isgiven
by
λ ΔE = 1239.9,
where ΔE is measured in electron volts (eV).
In computer graphics, it is not very efficient to simulate single photons; in-
stead large collections of them are simulated at the same time. If we take a very
large number of photons, each carrying a possibly different amount of energy,
531

i
i
i
i
i
i
i
i
532 21. Color
300 400 500 600 700 800 900
0
20
40
60
80
100
120
Relative Radiant Power
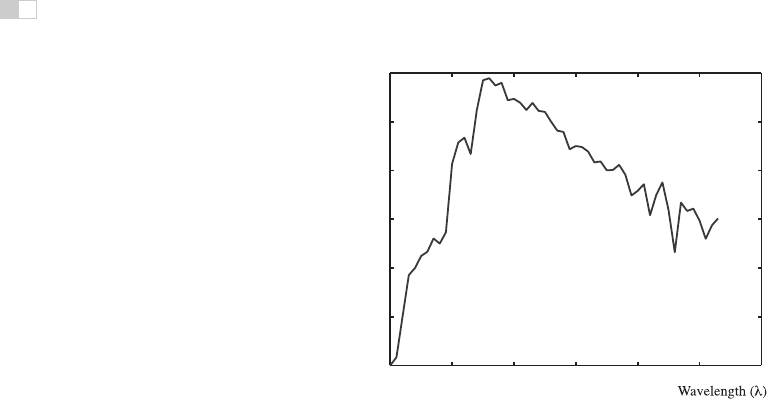
Figure 21.1. A spectrum describes how much energy is available at each wavelength λ,
here measured as relative radiant power. This specific spectrum represents average daylight.
then together they represent a spectrum. A spectrum can be thought of as a graph
where the number of photons is plotted against wavelength. Because two photons
of the same wavelength carry twice as much energy as a single photon of that
wavelength, this graph can also be seen as a plot of energy against wavelength.
An example of a spectrum is shown in Figure 21.1. The range of wavelengths to
which humans are sensitive is roughly between 380 and 800 nanometers (nm).
When simulating light, it would therefore be possible to trace rays that each
carry a spectrum. A renderer that accomplishes this is normally called a spectral
renderer. From preceding chapters it should be clear that we are not normally
going through the expense of building spectral renderers. Instead, we replace
spectra with representations that typically use red, green, and blue components.
The reason that this is possible at all has to do with human vision and will be
discussed later in this chapter.
Simulating light by tracing rays takes care of the physics of light, although it
should be noted that several properties of light, includingfor instance polarization,
diffraction, and interference, are not modeled in this manner.
At surface boundaries, we normally model what happens with light by means
of a reflectance function. These functions can be measured directly by means
of gonioreflectometers, leading to a large amount of tabled data, which can be
more compactly represented by various different functions. Nonetheless, these
reflectance functions are empirical in nature, i.e., they abstract away the chemistry
that happens when a photon is absorbed and re-emitted by an electron. Thus,
reflectance functions are useful for modeling in computer graphics, but do not
Get Fundamentals of Computer Graphics, 3rd Edition now with the O’Reilly learning platform.
O’Reilly members experience books, live events, courses curated by job role, and more from O’Reilly and nearly 200 top publishers.

