February 2012
Beginner to intermediate
220 pages
5h 8m
English
Gnuplot can graph functions whose x and y values depend on a third variable, called a parameter. In this way, more complicated curves can be drawn. The following plot resembles a lissajous figure, which can be seen on an oscilloscope when sine waves of different frequencies are controlling the x and y axes:
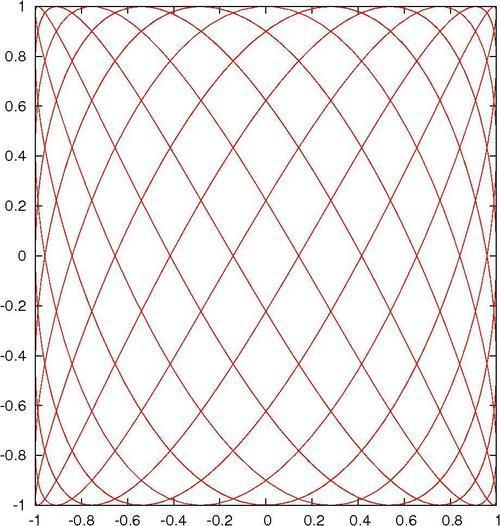
The following script creates the previous figure:
set samples 1000
set parametric
plot sin(7*t), cos(11*t) notitleWe want more samples than the default 100 for a smoother plot, hence the first line. The second line (highlighted) changes the way gnuplot interprets plot commands; now the two functions ...
Read now
Unlock full access


