February 2012
Beginner to intermediate
220 pages
5h 8m
English
Sometimes we would like to plot something over two disjoint domains, but want the plot to be contained in a single graph. In this case, we need to indicate that there is a discontinuity in the axis and generate two separate sets of tic marks, as shown in the following figure:
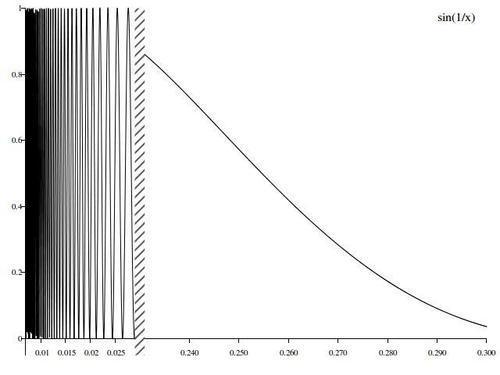
The following gnuplot script will produce the previous figure. It is provided with this book as a file called breaking_an_axis.gnuplot. Run it with gnuplot breaking_an_axis.gnuplot to get a PNG file that should look just like the previous figure. If you don't have the pngcairo terminal installed, you can use the png terminal or anything you wish, ...
Read now
Unlock full access


