Chapter 4. How to Think Like a Data Scientist
Practical Induction
Data science is about finding signals buried in the noise. It’s tough to do, but there is a certain way of thinking about it that I’ve found useful. Essentially, it comes down to finding practical methods of induction, where I can infer general principles from observations, and then reason about the credibility of those principles.
Induction is the go-to method of reasoning when you don’t have all of the information. It takes you from observations to hypotheses to the credibility of each hypothesis. In practice, you start with a hypothesis and collect data you think can give you answers. Then, you generate a model and use it to explain the data. Next, you evaluate the credibility of the model based on how well it explains the data observed so far. This method works ridiculously well.
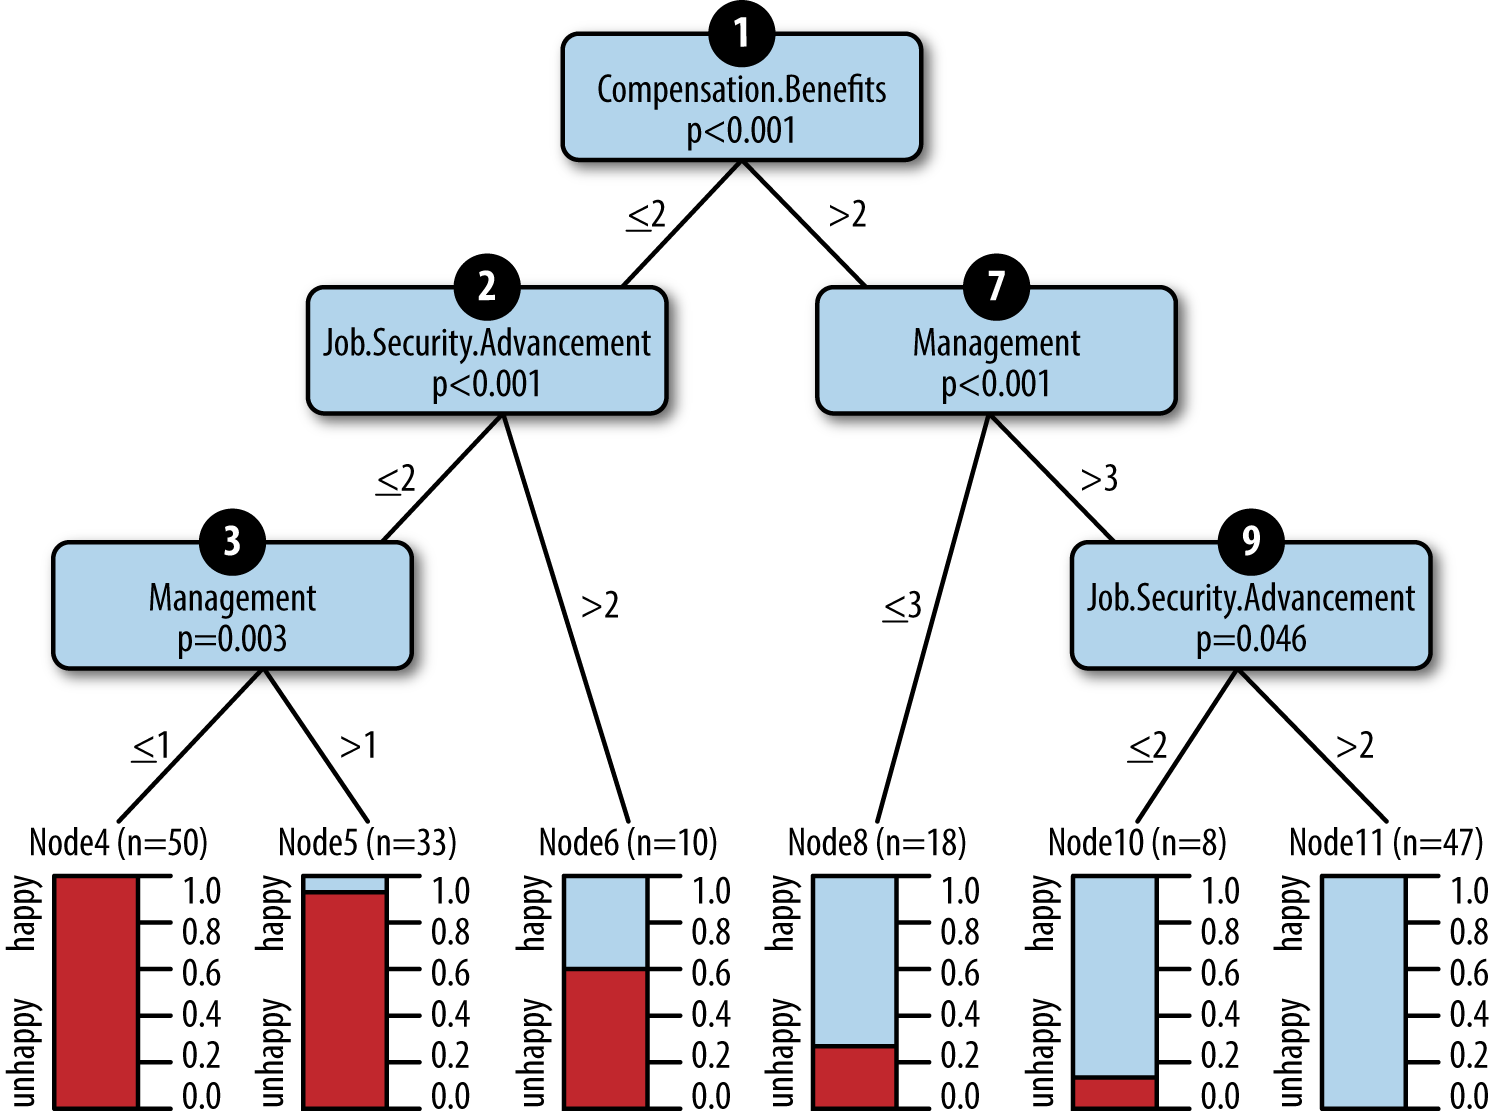
To illustrate this concept with an example, let’s consider a recent project, wherein I worked to uncover factors that contribute most to employee satisfaction at our company. Our team guessed that patterns of employee satisfaction could be expressed as a decision tree. We selected a decision-tree algorithm and used it to produce a model (an actual tree), and error estimates based on observations of employee survey responses (Figure 4-1).

Figure 4-1. A decision-tree model that predicts employee happiness
Each employee responded to questions on a scale from 0 to 5, with 0 being negative and 5 being positive. The leaf nodes of the tree provide a prediction of how many employees were likely to be happy under different circumstances. We arrived at a model that predicted—as long as employees felt they were paid even moderately well, had management that cared, and options to advance—they were very likely to be happy.
The Logic of Data Science
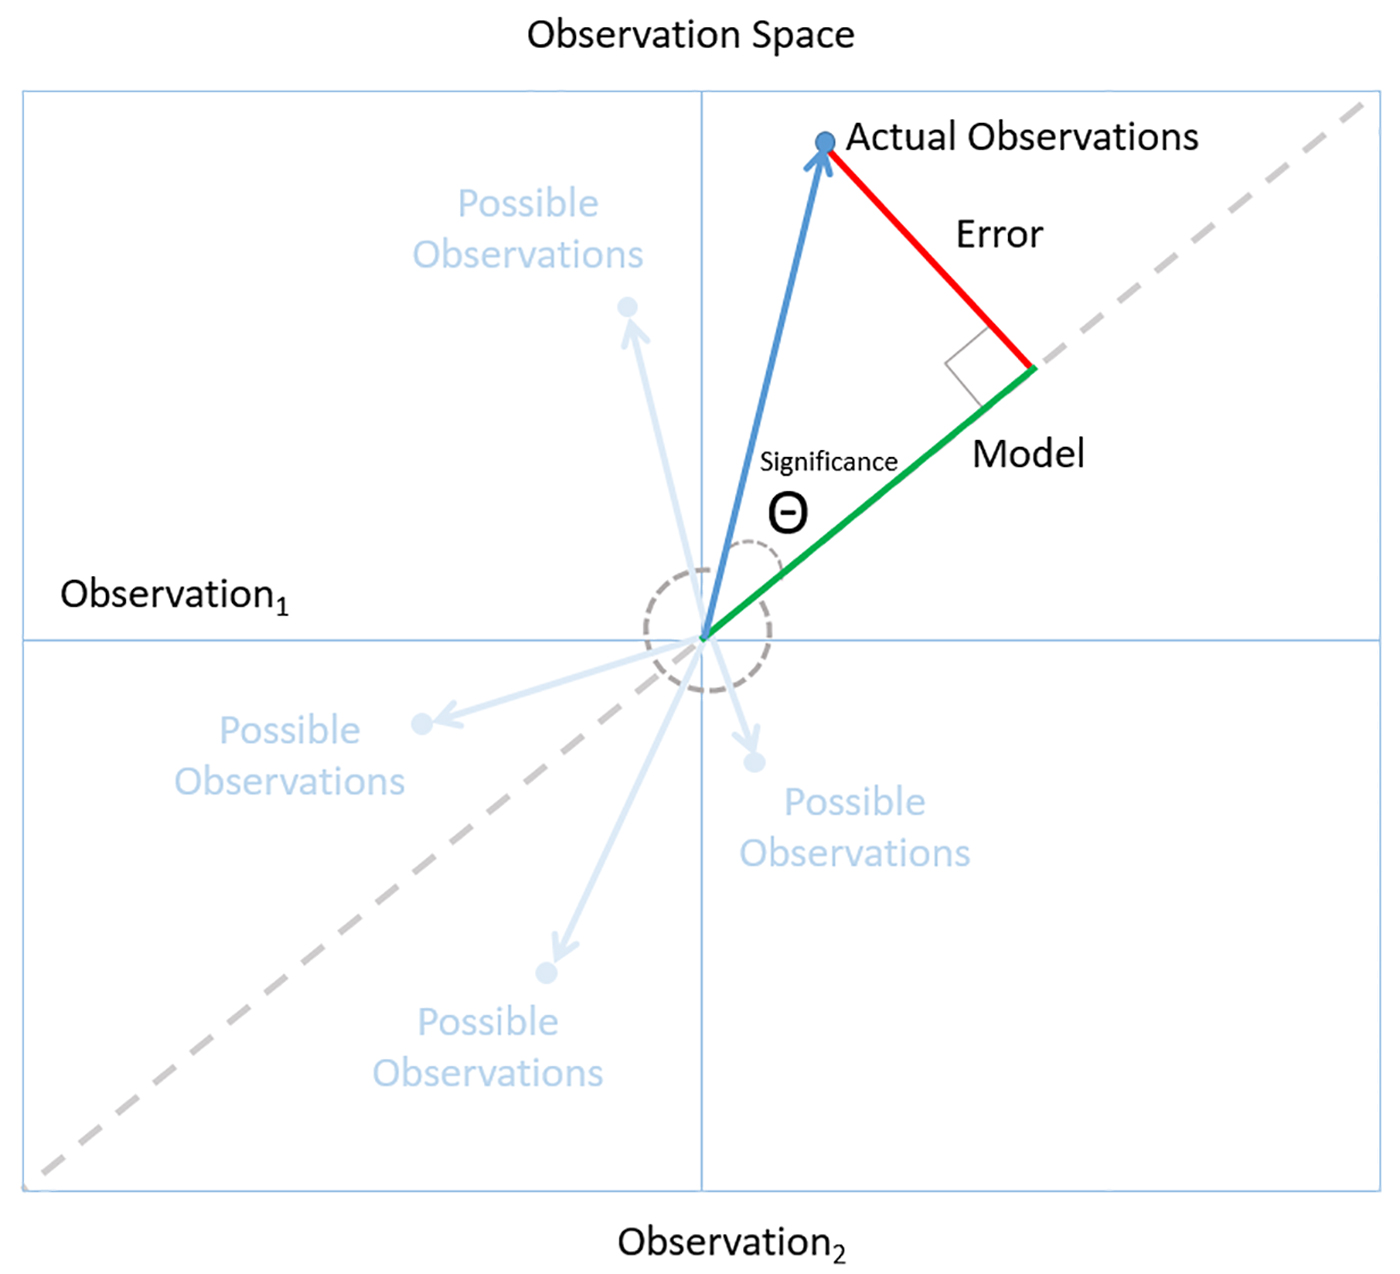
The logic that takes us from employee responses to a conclusion we can trust involves a combination of observation, model, error and significance. These concepts are often presented in isolation—however, we can illustrate them as a single, coherent framework using concepts borrowed from David J. Saville and Graham R. Wood’s statistical triangle. Figure 4-2 shows the observation space: a schematic representation that makes it easier to see how the logic of data science works.

Figure 4-2. The observation space: using the statistical triangle to illustrate the logic of data science
Each axis represents a set of observations. For example a set of employee satisfaction responses. In a two-dimensional space, a point in the space represents a collection of two independent sets of observations. We call the vector from the origin to a point, an observation vector (the blue arrow). In the case of our employee surveys, an observation vector represents two independent sets of employee satisfaction responses, perhaps taken at different times. We can generalize to an arbitrary number of independent observations, but we’ll stick with two because a two-dimensional space is easier to draw.
The dotted line shows the places in the space where the independent observations are consistent—we observe the same patterns in both sets of observations. For example, observation vectors near the dotted line is where we find that two independent sets of employees answered satisfaction questions in similar ways. The dotted line represents the assumption that our observations are ruled by some underlying principle.
The decision tree of employee happiness is an example of a model. The model summarizes observations made of individual employee survey responses. When you think like a data scientist, you want a model that you can apply consistently across all observations (ones that lie along the dotted line in observation space). In the employee satisfaction analysis, the decision-tree model can accurately classify a great majority of the employee responses we observed.
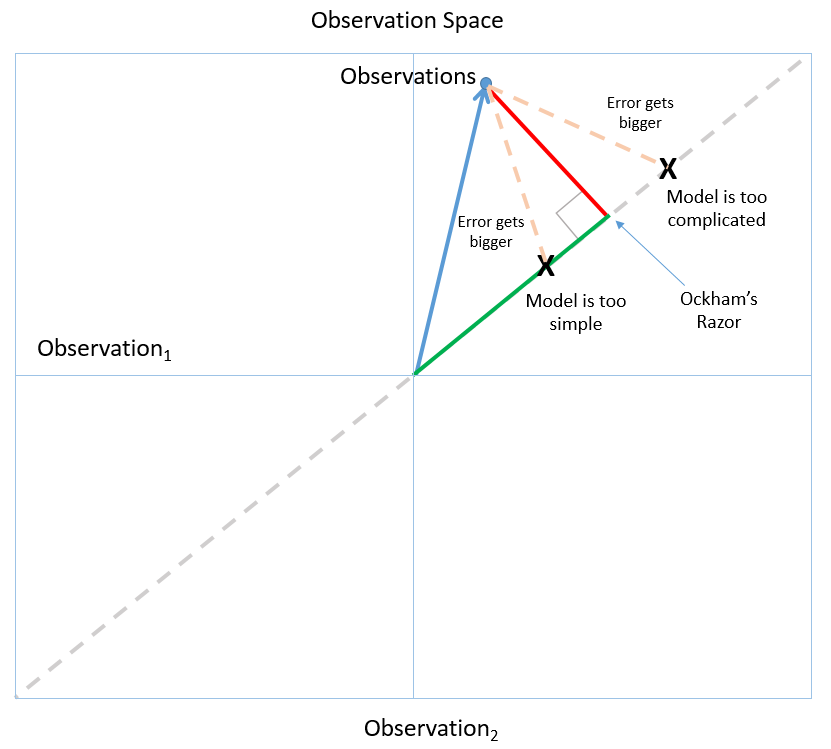
The green line is the model that fits the criteria of Ockham’s Razor (Figure 4-3): among the models that fit the observations, it has the smallest error and, therefore, is most likely to accurately predict future observations. If the model were any more or less complicated, it would increase error and decrease in predictive power.
Ultimately, the goal is to arrive at insights we can rely on to make high-quality decisions in the real world. We can tell if we have a model we can trust by following a simple rule of Bayesian reasoning: look for a level of fit between model and observation that is unlikely to occur just by chance. For example, the low P values for our employee satisfaction model tells us that the patterns in the decision tree are unlikely to occur by chance and, therefore, are significant. In observation space, this corresponds to small angles (which are less likely than larger ones) between the observation vector and the model. See Figure 4-4.

Figure 4-4. A small angle indicates a significant model because it’s unlikely to happen by chance
When you think like a data scientist, you start by collecting observations. You assume that there is some kind of underlying order to what you are observing and you search for a model that can represent that order. Errors are the differences between the model you build and the actual observations. The best models are the ones that describe the observations with a minimum of error. It’s unlikely that random observations will have a model that fits with a relatively small error. Models like these are significant to someone who thinks like a data scientist. It means that we’ve likely found the underlying order we were looking for. We’ve found the signal buried in the noise.
Treating Data as Evidence
The logic of data science tells us what it means to treat data as evidence. But following the evidence does not necessarily lead to a smooth increase or decrease in confidence in a model. Models in real-world data science change, and sometimes these changes can be dramatic. New observations can change the models you should consider. New evidence can change confidence in a model. As we collected new employee satisfaction responses, factors like specific job titles became less important, while factors like advancement opportunities became crucial. We stuck with the methods described in this chapter, and as we collected more observations, our models became more stable and more reliable.
I believe that data science is the best technology we have for discovering business insights. At its best, data science is a competition of hypotheses about how a business really works. The logic of data science are the rules of the contest. For the practicing data scientist, simple rules like Ockham’s Razor and Bayesian reasoning are all you need to make high-quality, real-world decisions.
Get Going Pro in Data Science now with the O’Reilly learning platform.
O’Reilly members experience books, live events, courses curated by job role, and more from O’Reilly and nearly 200 top publishers.


