Chapter 11 Communities
One of the most valuable applications of graph visualization and analytics is to explore community structure in large data sets. As shown in Figure 11-1, by organizing individual nodes into communities, you can see who or what is related from the 10,000-foot level. Good visualization can express what communities exist, their relative sizes and key characteristics, as well as how they relate to each other. When needed, visualization can also reveal who or what members belong to each community, or to which communities a member belongs. Analytics can tell you how cohesive a community is or how representative certain members are.
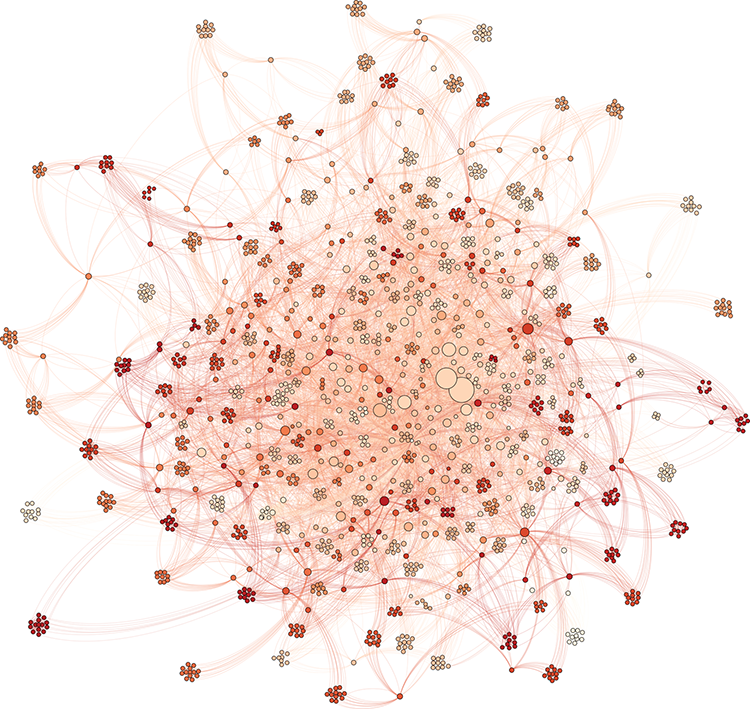
Figure 11-1: One of the primary uses for visualization of large graphs is to analyze community structure. Each cluster of nodes in this diagram reflects a community.
Knowledge of community characteristics and relationships is essential to any customer-driven business, especially when correlated with customer behavior. For example, when you can determine the defining qualities of your best and worst customers or discover purchasing patterns for different customer profiles, you can then optimize sales through better targeting strategies. And when you understand the way in which different types of clients tend to respond to promotions and experiences, you can better tailor services and improve performance, and ultimately increase revenues. ...
Get Graph Analysis and Visualization: Discovering Business Opportunity in Linked Data now with the O’Reilly learning platform.
O’Reilly members experience books, live events, courses curated by job role, and more from O’Reilly and nearly 200 top publishers.

