Chapter 1
Setting the Scene
‘What is the use of a book’, thought Alice, without pictures or conversations?’
Lewis Carroll
1.1 Graphics in action
The code for producing Figure 1.1 is:
library(ggplot2); library(ggthemes)
data(SpeedSki, package = "GDAdata")
ggplot(SpeedSki, aes(x=Speed, fill=Sex)) + xlim(160, 220) +
geom_histogram(binwidth=2.5) + xlab("Speed (km/hr)") +
facet_wrap(~Sex, ncol=1) + ylab("") +
theme(legend.position="none")
Figure 1.1
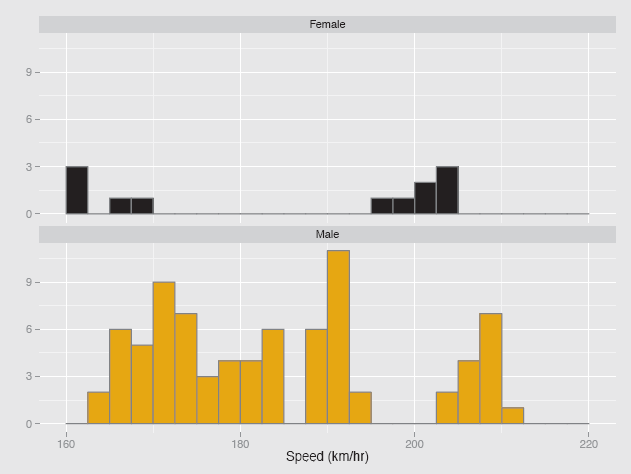
Histograms of speeds reached at the 2011 World Speed Skiing Championships. Source: www.fis-ski.com. There were more male competitors than females, yet the fastest group of females were almost as fast ...
Get Graphical Data Analysis with R now with the O’Reilly learning platform.
O’Reilly members experience books, live events, courses curated by job role, and more from O’Reilly and nearly 200 top publishers.

