2
FUNDAMENTALS OF GROWTH
2.1 TIME SERIES DATA
We may view a time series as a set of observations Yt, t = 0, 1, 2, ..., n, on a variable Y that are indexed in order of time; that is, the Yt's are measured at different time points or time intervals. Since t is the time index, if our data series starts in, for instance, 1980 and we have observations going to 2005 in one-year intervals, then we can assign a sequence of numbers to order the data points. In this regard, let us designate 1980 as the origin and assign it the value “0.” Then 1981 is assigned the value 1, 1982 is given the value 2, and so on. Hence, we end up with the sequence of numbers 0, 1, 2, ..., 25 as the set of observations on the time variable t. The convenience of this numerical assignment scheme for representing a sequence of years (or weeks, months, etc.) will become evident later on.
2.2 RELATIVE AND AVERAGE RATES OF CHANGE
Given the time series Yt, t = 0, 1, ..., n, let us define the relative rate of change in Y between periods t−1 and t as

TABLE 2.1 Relative Growth Rates in Y and Growth Relatives
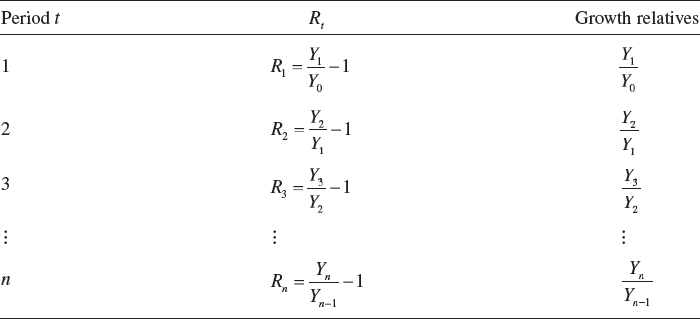
If Y0 denotes the value of Y at the beginning of period 1 and Yt represents the value of Y at the end of period t, t = 1, ..., n, then the sequence of relative rates of growth over the entire time span appears in
Get Growth Curve Modeling: Theory and Applications now with the O’Reilly learning platform.
O’Reilly members experience books, live events, courses curated by job role, and more from O’Reilly and nearly 200 top publishers.

