APPENDIX A
TABLE A.1 Standard Normal Areas (Z Is N(0, 1))
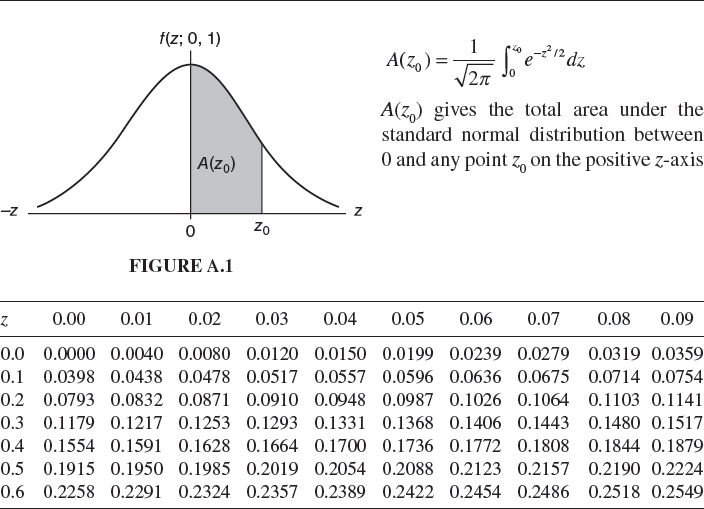
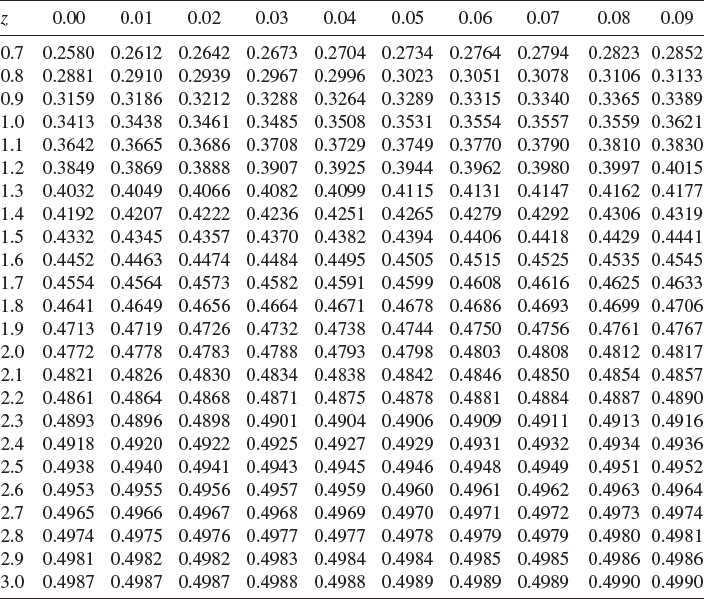
TABLE A.2 Quantiles of Student's t Distribution (T Is tv)
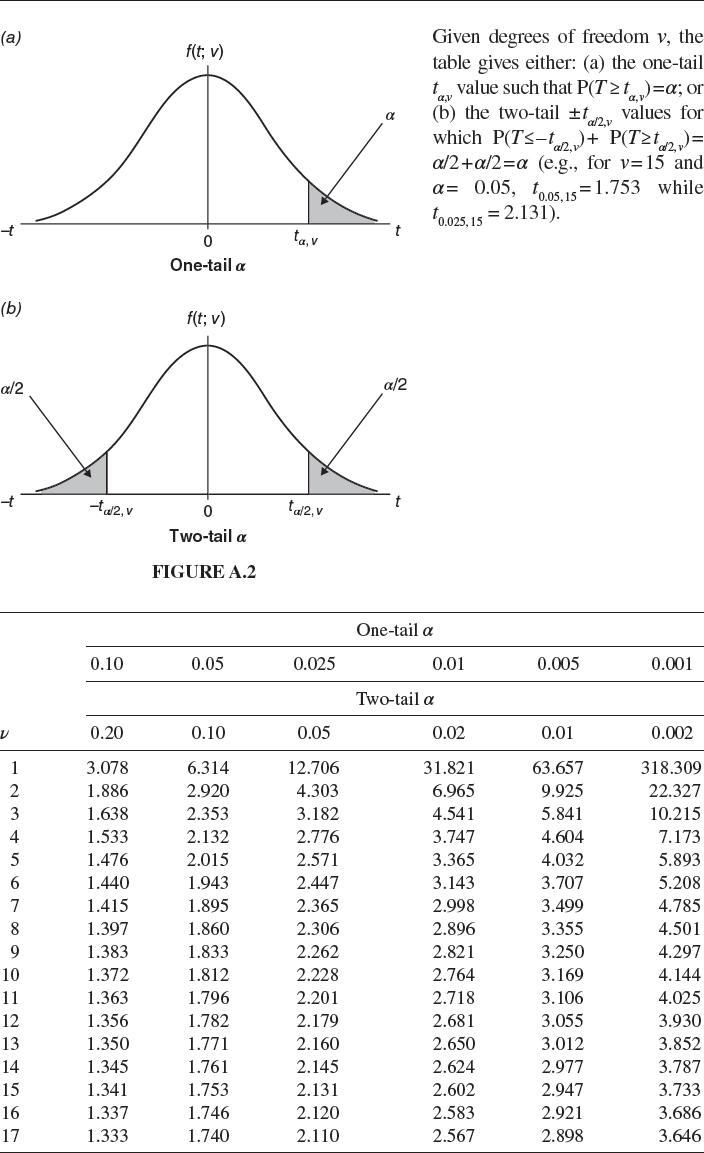
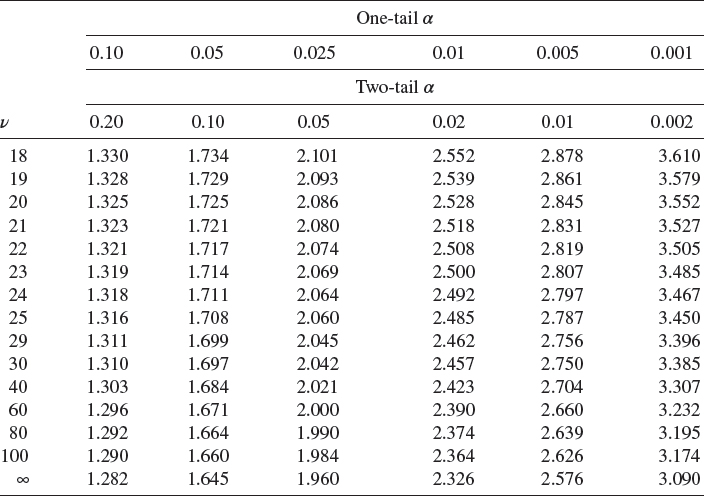
TABLE A.3 Quantiles of the Chi-Square Distribution (X Is ![]() )
)
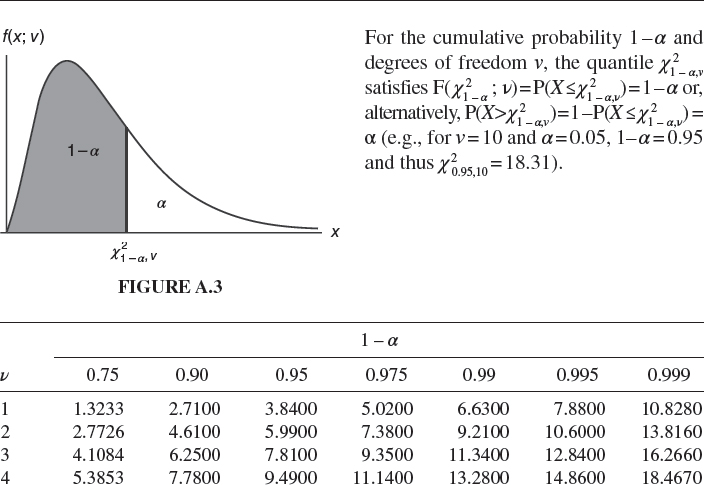
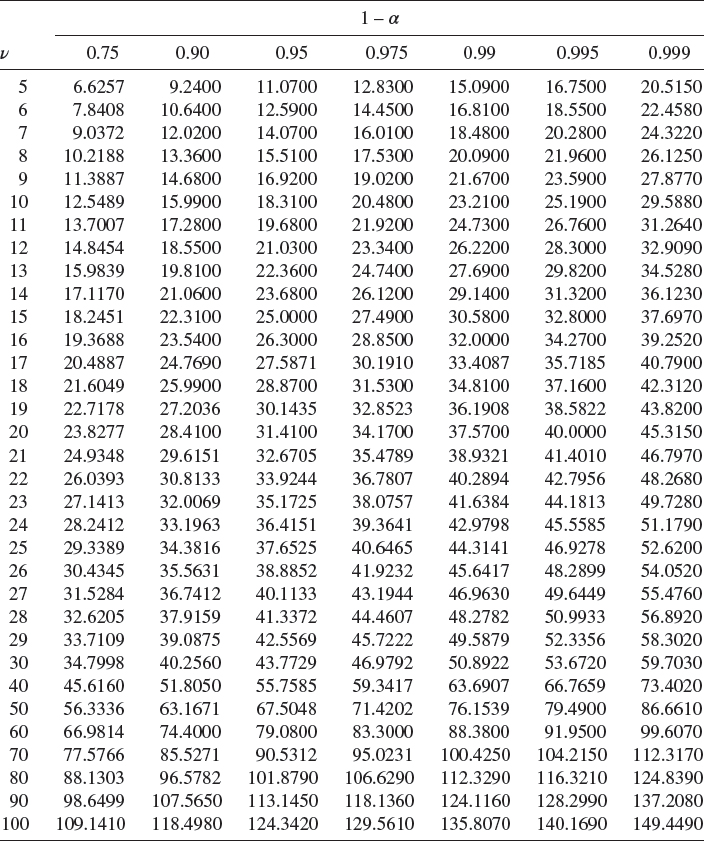
TABLE A.4 Quantiles of Snedecor's F Distribution (F Is Fv1, v2)
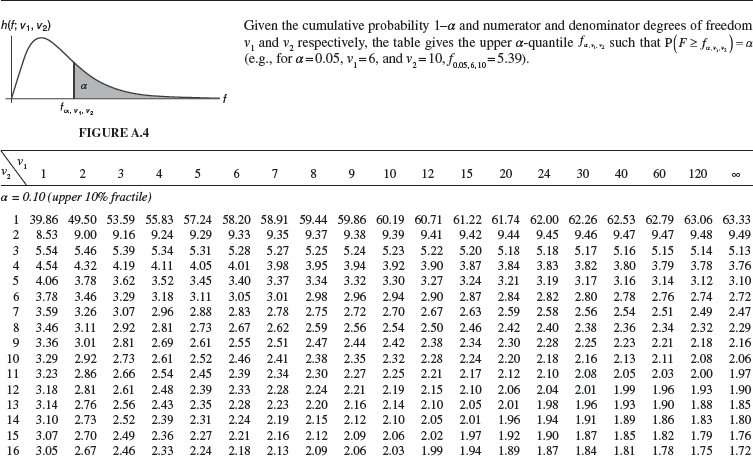
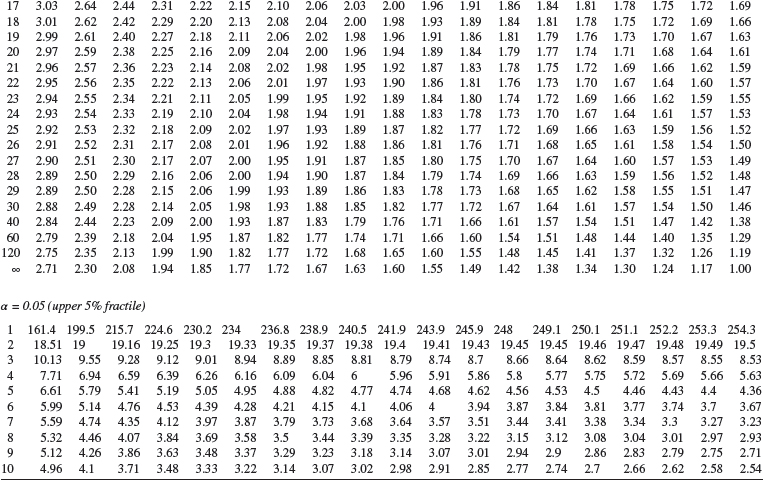
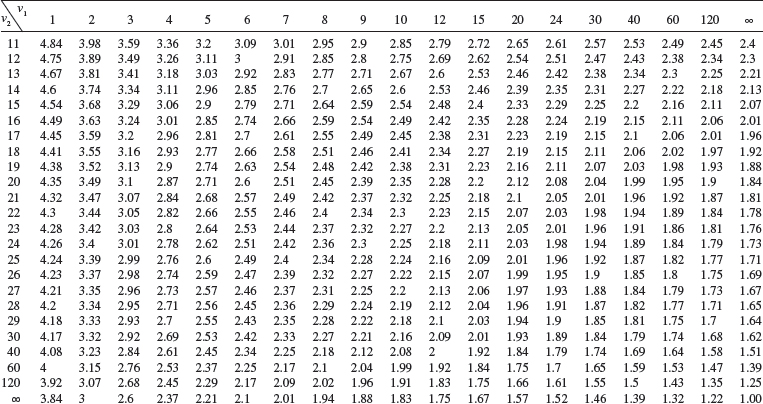
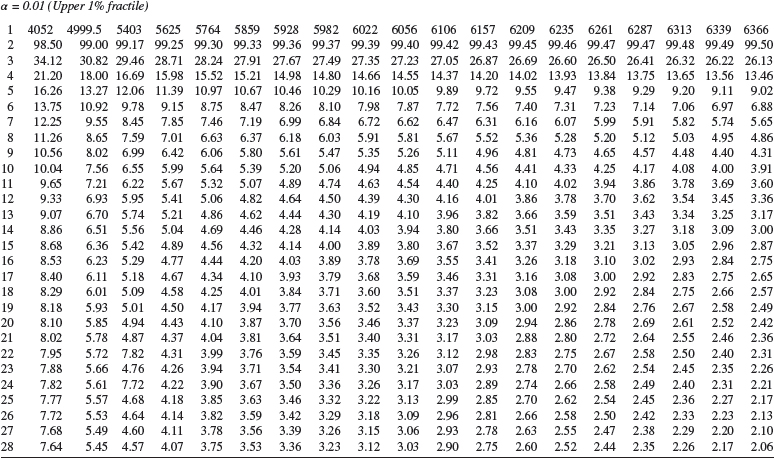
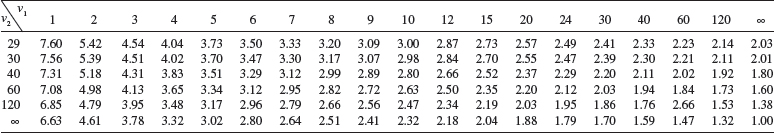
TABLE A.5 Durbin–Watson DW Statistic—5% Significance ...
Get Growth Curve Modeling: Theory and Applications now with the O’Reilly learning platform.
O’Reilly members experience books, live events, courses curated by job role, and more from O’Reilly and nearly 200 top publishers.

