Vector and Tensor Field Visualization
Gerik Scheuermann and Hans Hagen
27.1 INTRODUCTION
“Visualization transforms data into images that efficiently and accurately represent information about the data” [49, p.83]. This definition describes the visualization task as a transformation process like the one in Figure 27.1.
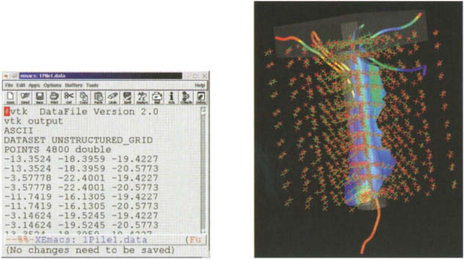
Figure 27.1 Visualization transforms data into images. Here, tensor data together with geometry is transformed into a computer generated image.
It is obvious on one side that one needs knowledge about the data and its underlying context to do the job. On the other side, it is necessary to use the whole repertoire ...
Get Handbook of Computer Aided Geometric Design now with the O’Reilly learning platform.
O’Reilly members experience books, live events, courses curated by job role, and more from O’Reilly and nearly 200 top publishers.

