Section 27
Health and Safety
Charts
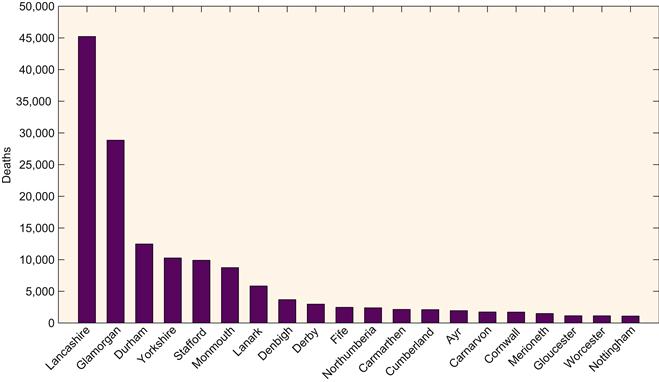
Chart 27.1 County distribution of deaths in United Kingdom coal mines, top 20 counties, 1700–2000. Source: Data from The Coalmining History Resource Centre, <http://www.cmhrc.co.uk>.
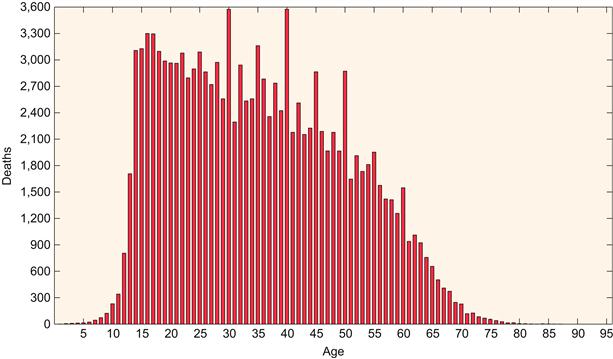
Chart 27.2 Age distribution of deaths in United Kingdom coal mines, 1700–2000. Source: Data from The Coalmining History Resource Centre, <http://www.cmhrc.co.uk>.
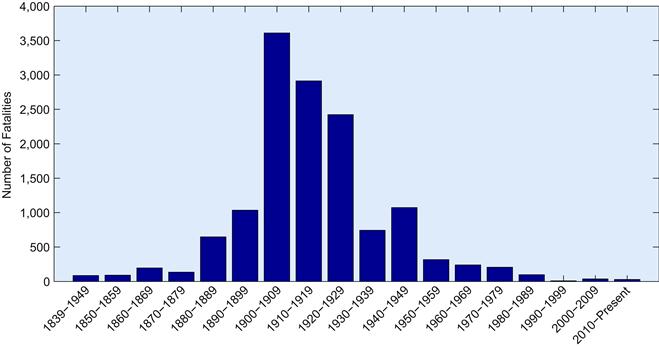
Chart 27.3 Fatalities in United States coal mines by decade, 1839–2010. ...
Get Handbook of Energy now with the O’Reilly learning platform.
O’Reilly members experience books, live events, courses curated by job role, and more from O’Reilly and nearly 200 top publishers.

