Finally, let's go ahead and create the pivot table chart. So, to do that, we will again use the same steps that we applied for the previous charts. We will select aircraft_group_name, aircraft_type_name, and carrier_type_name as the dimensions, and for the expression, we will again use the Sum(PASSENGERS) expression. Once everything has been set up, we will click on Finish. This gives us the following object:
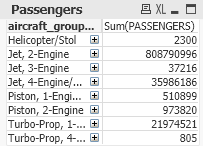
We can expand the table to see various types of data, based on what you want to look at, as seen in the following screenshot:
So, these are the three charts that we have learned about here. We can now use them to add ...

