To create an ETW trace for our example program, we open UI for ETW, start trace collecting, launch our example, work with it, close it eventually, and then click on Save Trace Buffers. You can stop trace collection by clicking on the Cancel Tracing button if you wish. Now, by double-clicking on the trace filename, as visible in the previous screenshot, we can open the WPA viewer, as shown in the following screenshot:
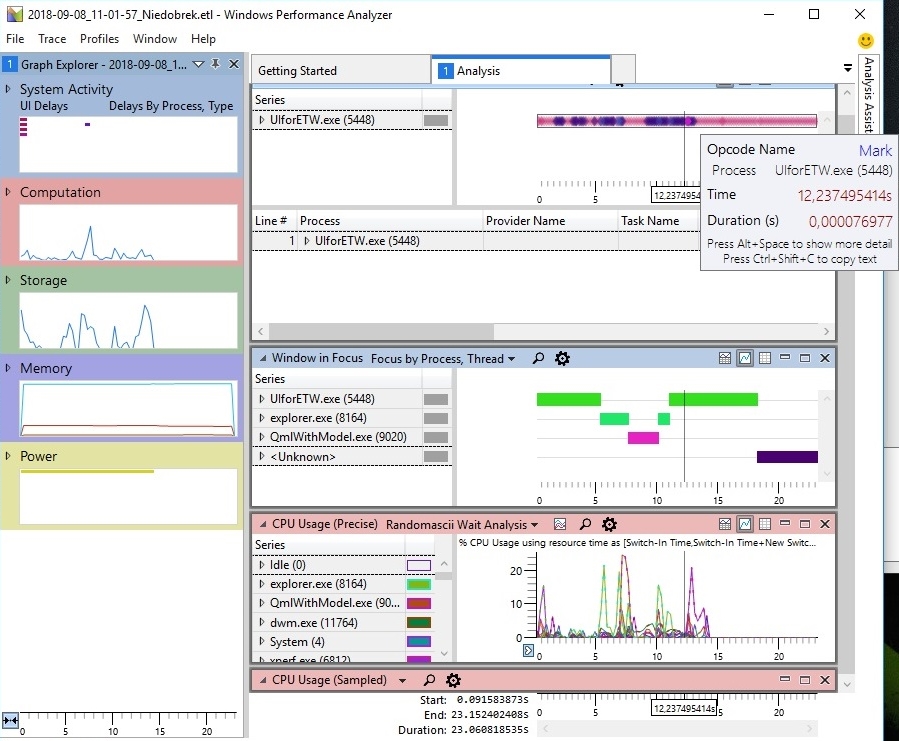
We can see that UI for ETW is not only a better GUI for the xperf tool, it also adds its own providers, recording power consumption, heat, keyboard input, flame graphs, and so on. Moreover, it ...

