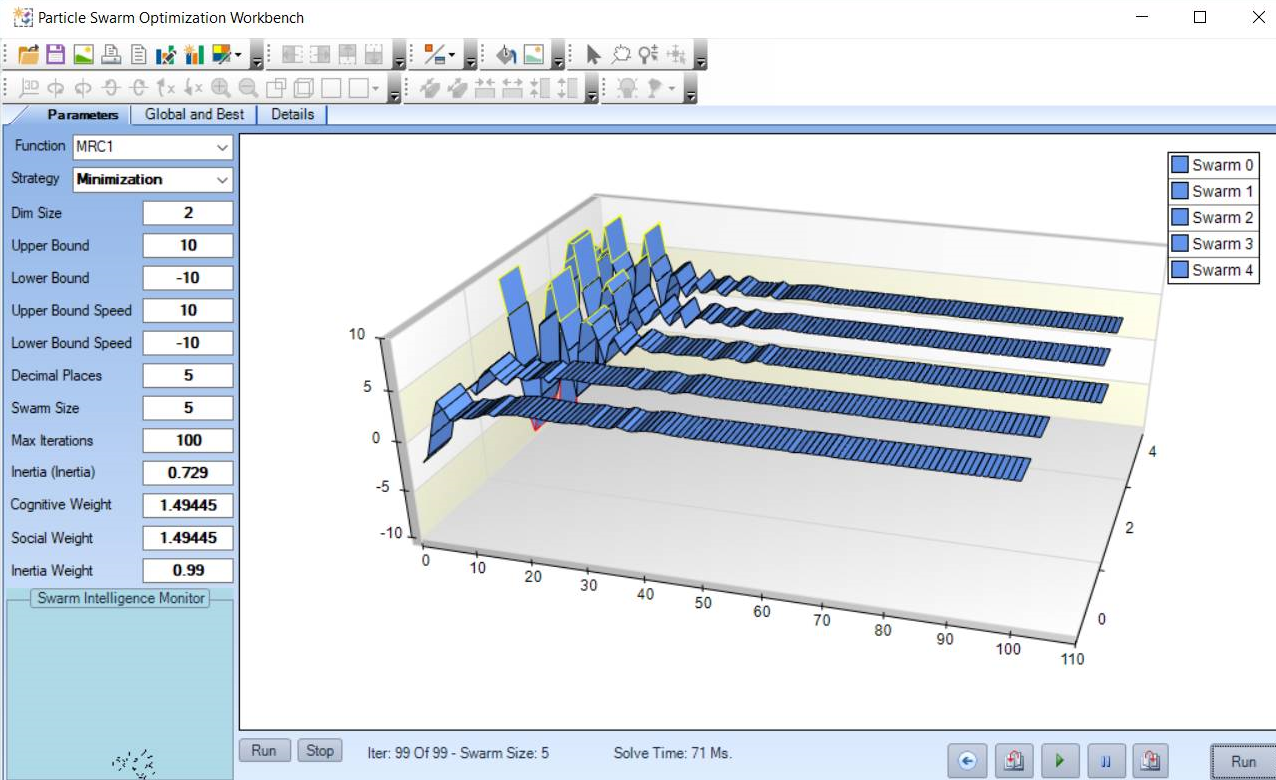
Before we get started, let me show you the product we are going to create. When we are done you will have an application that allows you to view graphically how a function minimizes or maximizes over iterations. This is contrary to the typical text-based representations of such systems, as follows:

As you can see, this is a very visual application. Let's go ahead and break this down into sections that we will refer to as we progress.
The first section is the three-dimensional plot and is located on our main page. Three dimensions can provide much more insight into the path that each particle in the swarm takes, and ...

