In my opinion, the three-dimensional view is the easiest to interpret and the most intuitive, especially if it is a part of your model verification package that you will show to someone else. You can easily see in the following when each particle arrives (if it arrives) at a global optimum. The result is a flat line indicated by one or more line segments at the 0 axis:
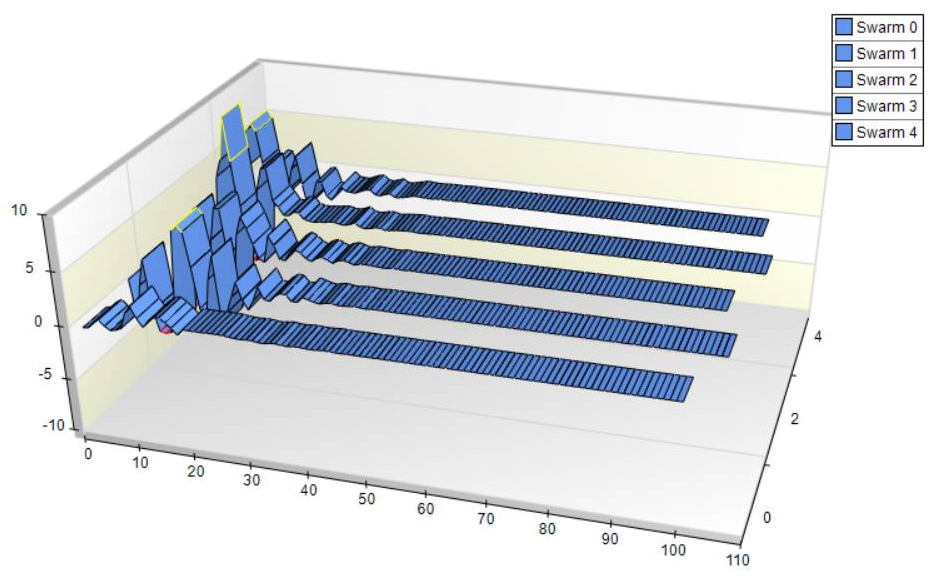
3D Visualization
There are several toolbars available for working with the three-dimensional view, of which you have rotational options, placement options, color options, and more:
You can use the Trackball to rotate the chart ...

