Appendix B. Statistics Tables: Looking Things Up

Where would you be without your trusty probability tables?
Understanding your probability distributions isn’t quite enough. For some of them, you need to be able to look up your probabilities in standard probability tables. In this appendix, you’ll find tables for the normal, t, and χ2 distributions, so you can look up probabilities to your heart’s content.
#1. Standard normal probabilities
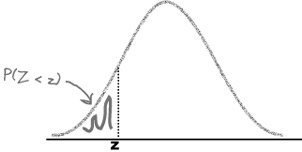
This table gives you the probability of finding P(Z < z) where Z ~ N(0, 1). To find the P(Z < z), look up your value of z to 2 decimal places, then read off the probability.

z NoteLook up the value of z using the first column and first row... | .00 | .01 | .02 | .03 | .04 | .05 | .06 | .07 | .08 | .09 |
–3.4 | .0003 | .0003 | .0003 | .0003 | .0003 | .0003 | .0003 Note...then read off the probability from the table. | .0003 | .0003 | .0002 |
–3.3 | .0005 | .0005 | .0005 | .0004 | .0004 | .0004 | .0004 | .0004 | .0004 | .0003 |
–3.2 | .0007 | .0007 | .0006 | .0006 | .0006 | .0006 | .0006 | .0005 | .0005 | .0005 NoteThese are the probabilities for P(Z > z) where z is negative. |
–3.1 | .0010 | .0009 | .0009 | .0009 | .0008 | .0008 | .0008 | .0008 | .0007 | .0007 |
–3.0 | .0013 | .0013 | .0013 | .0012 | .0012 | .0011 | .0011 | .0011 | .0010 | .0010 |
–2.9 | .0019 | .0018 | .0018 | .0017 | .0016 | .0016 | .0015 | .0015 | .0014 | .0014 |
–2.8 | .0026 | .0025 | .0024 | .0023 | .0023 | .0022 | .0021 | .0021 | .0020 | .0019 |
–2.7 | .0035 | .0034 | .0033 | .0032 | .0031 | .0030 | .0029 | .0028 | .0027 | .0026 |
–2.6 | .0047 | .0045 | .0044 | .0043 | .0041 | .0040 | .0039 |
Get Head First Statistics now with the O’Reilly learning platform.
O’Reilly members experience books, live events, courses curated by job role, and more from O’Reilly and nearly 200 top publishers.

