Chapter 4. JPEG
JPEGs are the Web’s most abundant image file format. According to the HTTP archive, at the time of this writing, they make up 45% of all image requests, and about 65% of image traffic. They are good candidates for full-color images and digital photos, making them the go-to image format whenever people want to share important moments in their lives (e.g., what they are having for brunch) over the Internet. JPEG’s capability of lossily compressing images to save bandwidth (without losing too much quality in the process) has gained the format worldwide adoption.
History
The need for photographic image compression was clear from the early days of personal computing. Multiple proprietary formats were devised in order to achieve that, but eventually, the need to share these images between users made the case for a standard format clear.
Even before the Internet was widespread, corporations shared images with their users over CD-ROMs with limited storage capacity, and wanted the users to be able to view these images without installing proprietary software. In the early days of the Internet (then mostly at 9,600 baud speeds), it was apparent that a standard format could not come soon enough.
A few years earlier, back in 1986, the Joint Photographic Experts Group was formed, and after six years of long debates, it published the ITU T.81 standard in 1992. The group’s acronym was adopted as the popular name of this new format: JPEG.
The JPEG Format
The bytestream of files that we call JPEG nowadays (often with extensions such as .jpg and .jpeg) is not a direct result of a single standard. These files are composed of a container and payload. The payload corresponds to the original T.81 standard (or, to be more accurate, to a subset of that standard that is supported by browsers), while the container is defined by other standards entirely, and is used to, well, “contain” the payload and important metadata about the image that the decoder needs in order to decode it.
Containers
The T.81 standard actually defined a standard JPEG container called JIF, for JPEG Interchange Format. But JIF failed to gain traction, mostly because it was overly strict and failed to provide some information that was required for the decoding process. Luckily JIF was built with forward compatibility in mind, so it was soon succeeded by other, backward-compatible container formats.
There are two commonly used types of JPEG containers today: JFIF and EXIF.
JFIF stands for JPEG File Interchange Format, and is the older and more basic of the two containers. EXIF stands for Exchangeable Image File Format, and can contain far more metadata than JFIF, such as where the image was taken, the camera’s settings, copyright, and other metadata that might be relevant for humans editing and manipulating the image, but is not required to display the image in a browser.
Later, we will see how lossless optimization often trims that data in order to reduce its size. What is common to all these container types is their internal structure, which is somewhat similar and comprised of markers.
Markers
Each JPEG file, regardless of container, is composed of markers. These markers all start with the binary character 0xff, where the following character determines the marker’s type. The JFIF and EXIF parts are contained in “application markers” comprising segments that hold container-specific information. Decoders that weren’t created to interpret or use JFIF- or EXIF-specific markers simply ignore them and move on to the next marker.
Here are a few markers that are fairly important in the JPEG world:
- SOI
-
The “Start of Image” marker represents the start of the JPEG image. It is always the first marker in the file.
- SOF
-
“Start of Frame” represents the start of the frame. With one nonpractical exception, a JPEG file will contain a single frame.
- DHT
-
“Define Huffman Table” contains the Huffman tables. We’ll discuss them in detail in “Entropy Coding”.
- DQT
-
“Define Quantization Table” contains the quantization tables, which we’ll discuss in “DCT”.
- SOS
-
“Start of Scan” contains the actual image data. We’ll discuss its content shortly.
- EOI
-
“End of Image” represents the end of the JPEG image, and should always be the last marker of the file.
- APP
-
Application markers enable extensions to the basic JIF format, such as JFIF and EXIF.
The terms image, frame, scan, and component can be confusing, so let’s clarify them. Each JPEG is a single image, which contains (in all practical cases) a single frame, and a frame can contain one or many scans, depending on the encoding mode, which we’ll discuss momentarily. On top of that, each scan can contain multiple components. Quite the Russian doll.
One thing that is often surprising is that the JPEG’s pixel dimensions can be buried rather deep inside the bytestream, as part of the Start of Frame (SOF) marker’s header. That means that for JPEGs with a lot of data before that marker (notably EXIF-based JPEGs with a lot of metadata), the information regarding the JPEG’s dimensions may come in pretty late (see Figure 4-1). That can be a problem if you’re processing the JPEG on the fly, and particularly, large chunks of EXIF data can often mean that the browser knows the image dimensions significantly later than it could have if the (irrelevant) EXIF data wasn’t there.
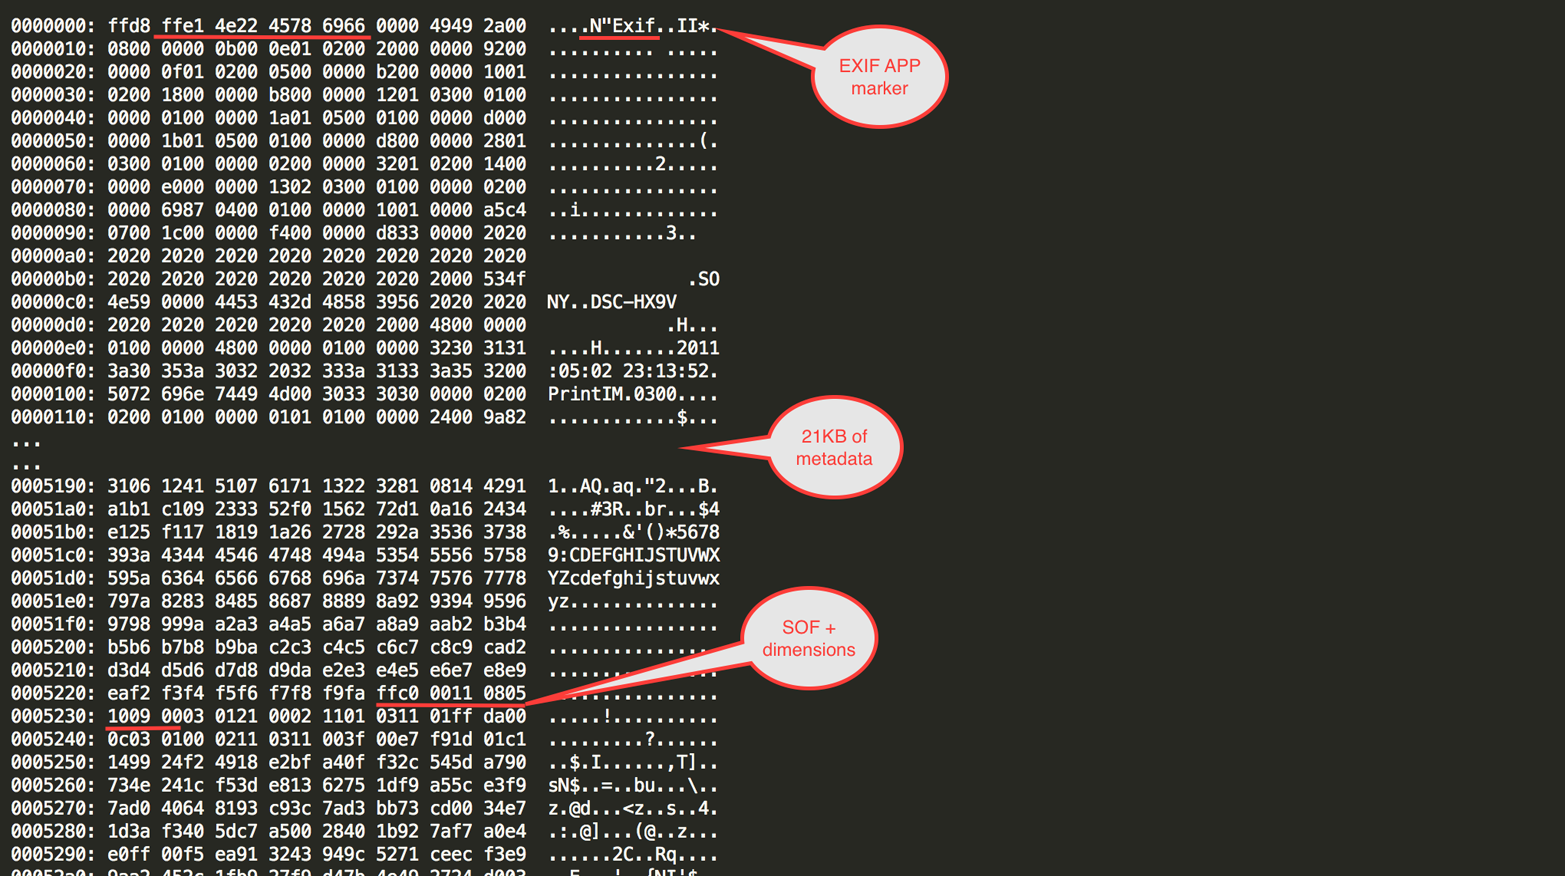
Figure 4-1. A JPEG with EXIF data
Since browsers use the presence of image dimensions for layout changes in certain cases, as well as for triggering various internal processing events, the presence of EXIF metadata in your images can have a significant negative impact on your site’s performance.
Color Transformations
Another key concept about JPEGs is that they convert the input image from its origin RGB color model to the YCbCr color model, breaking the image into brightness, blue chroma, and red chroma components.
As discussed in Chapter 2, the human eye is more sensitive to luminance details than it is to details in color components. That means that we can generally get away with relatively high color component detail loss, while the same is not always true for the luma component.
JPEG takes advantage of that and applies different (and often harsher) compression on the color components of the image.
As we’ve seen, one disadvantage of YCbCr versus other, more modern color models (e.g., YCgCo) is that YCbCr is not binary fraction friendly. Those mathematical operations, when carried out by a computer, are bound to lose some precision, and therefore an RGB to YCbCr to RGB conversion is somewhat lossy in practice. That adds to the lossy aspect of the format.
Subsampling
One of the major ways that compression of the color components is performed is through subsampling. Sampling, which you learned about in Chapter 2, is about fitting an analog signal (e.g., a real-life image of continuous color) into an inherently discrete medium, such as a pixel bitmap, a process which by definition loses detail and precision.
Subsampling is about losing even more precision during the sampling (or re-sampling) process, resulting in less detail, entropy, and eventually bytes to send to the decoder.
When we discuss subsampling in JPEG, we are most often talking about chroma subsampling: subsampling of the color components. This process reduces the color component sampling precision, which is OK since the human eye tends to be more forgiving of lost color precision details.
How is subsampling done in JPEG? There are multiple patterns for possible subsampling in the JPEG standard. In order to understand what these subsampling patterns mean, let’s start by drawing a 4×2-pixel row of the Cb (blue chroma) component (see Figure 4-2).
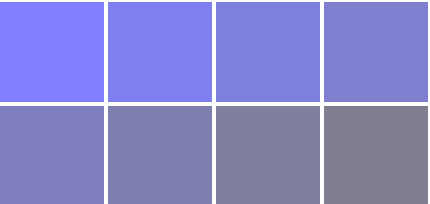
Figure 4-2. A 4×2-pixel block
As you can see, each pixel has a different value. Subsampling means that we coelesce some of those colors into a single intensity value.
The notation given to the various subsampling patterns is J:a:b, where:
-
J is the number of pixels in each row. For JPEG that number is often 4. There are always 2 rows.
-
a represents the number of colors used from the first row.
-
b represents the number of colors used in the second row.
In case you’re dozing off, let’s look at a few examples. Figure 4-3 shows a few subsampling patterns with that notation.

Figure 4-3. Various subsampling results of 4×2-pixel block from Figure 4-2
If you were paying attention, you may have noticed that the 4:4:4 example is exactly the same as the original. In fact, 4:4:4 means that for each row of four pixels, four colors are picked, so no subsampling is taking place.
Let’s take a look at what other subsampling patterns are doing.
4:4:0 means that color intensity is averaged between every two vertical pixels in the 4×2 block. In 4:2:2 intensity is averaged between two horizontally neighboring pixels. 4:2:0 averages intensity between the pixels in each 2×2 block inside the 4×2 block. And finally, 4:1:1 means that intensity is averaged between four vertically neighboring pixels.
This example is tainted to make it clear that we’re talking about chroma subsampling, but you should note that each pixel in the example represents the intensity of only one of the color components. That makes it significantly easier to average the pixel color intensity without losing too much color precision.
Also, as you can notice from these examples, not all subsampling methods are created equally, and some are more likely to be noticeable than others. In practice, most JPEGs “in the wild” exhibit either 4:4:4 subsampling (so no subsampling at all) or 4:2:0 (see Figure 4-4).
Note that some color combinations become impossible to represent with subsampling—for example, 1-pixel-wide red lines over a blue background. However, such patterns are not that common in real-life photography.
We have seen that we lose precision by subsampling, but what do we gain from it?
By getting rid of pixels in the chroma components we effectively reduce the size of the color component bitmap by half for 4:2:2 and 4:4:0 subsampling and by three-quarters (!) for 4:2:0 and 4:1:1. That drop in pixel count equates to significant byte size savings as well as significant memory savings when we’re dealing with the decoded image in memory. We’ll further discuss these advantages in Chapter 9.
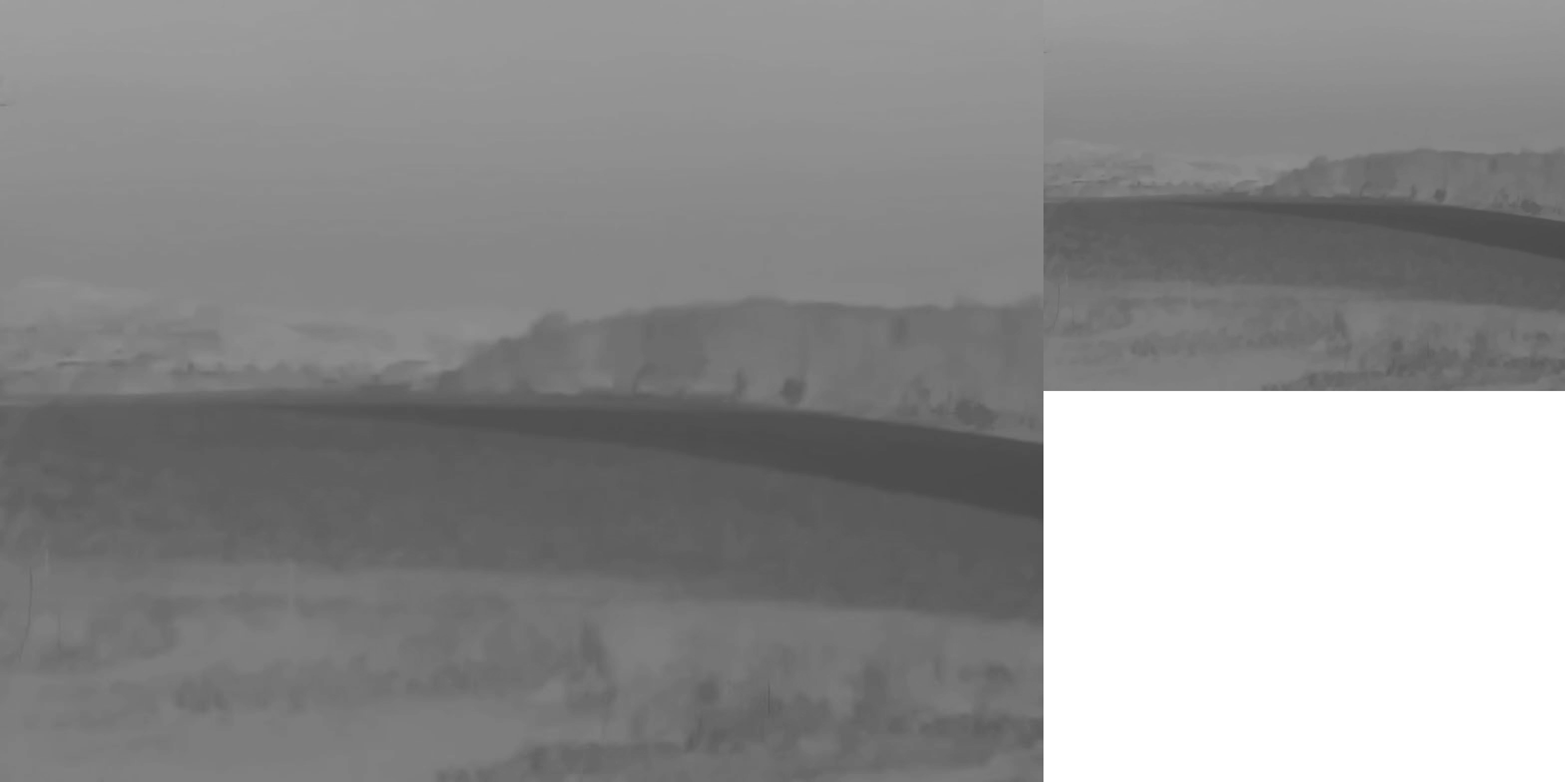
Figure 4-4. To the left, the original (untainted) Cb component; to the right, the same component after 4:2:0 subsampling
Entropy Coding
As discussed in Chapter 2, entropy coding is a technique that replaces data stream symbols with codes, such that common symbols get shorter codes.
The JPEG standard includes two different options for entropy encoders: Huffman encoding and arithmetic encoding.
Huffman encoding has been around since 1952, and is based on the idea that once the frequency of the symbols in the data stream is known, the symbols are sorted by their frequency using a binary tree. Then each symbol gets assigned a code that represents it, which is shorter the more frequent the symbol appears in the encoded data stream. One more important quality is that no code is a prefix of another, longer code. That is, no two or more codes, when concatenated, comprise another, longer code. That fact avoids the need to add length signals for each code, and makes the decoding process straightforward.
Huffman encoding is widely used and has lots of advantages, but suffers from one downside: the codes assigned to each symbol are always comprised of an integer number of bits. That means that they cannot reflect with complete accuracy the symbol frequency, and therefore, leave some compression performance on the table.
Arithmetic encoding to the rescue!
Arithmetic encoding is able to encode a symbol using fractions of a bit, solving that problem and achieving the theoretical encoding ideal. How does arithmetic coding do that “fractions of a bit” magic? It uses an (extremely long) binary fraction as the code representing the entire message, where the combination of the fraction’s digits and the symbol’s probability enable decoding of the message.
Unfortunately, when it comes to JPEGs, Huffman encoding is the option that is most often used, for the simple fact that arithmetic encoding is not supported by most JPEG decoders, and specifically not supported in any browser. The reason for that lack of support is that decoding of arithmetic encoding is more expensive than Huffman (and was considered prohibitively expensive in the early days of JPEGs), and it was encumbered by patents at the time that JPEG was standardized. Those patents have long expired, and computers are way better at floating-point arithmetic than they used to be in 1992; however, support in decoders is still rare, and it would also be practically impossible to introduce arithmetic encoding support to browsers without calling these JPEGs a brand new file format (with its own MIME type).
But even if arithmetic encoding is rarely used in JPEGs, it is widely used in other formats, as we’ll see in Chapter 5.
While entropy codings can be adaptive, meaning that they don’t need to know the probabilities of each symbol in advance and can calculate them as they pass the input data, Huffman in JPEG is not the adaptive variant. That means that often the choice is between an optimized, customized Huffman table for the JPEG, which has to be calculated in two passes over the data, and a standard Huffman table, which only requires a single pass but often produces compression results that are not as good as its custom, optimized counterpart.
Huffman tables are defined in the DHT marker, and each component of each scan can use a different Huffman table, which can potentially lead to better entropy encoding savings.
DCT
In Chapter 2, we touched upon converting images from the spatial domain to the frequency domain. The purpose of such a conversion is to facilitate filtering out high-frequency brightness changes that are less visible to the human eye.
In JPEG, the conversion from the spatial domain to frequency domain and back is done by mathematical functions called Forward Discrete-Cosine Transform (FDCT) and Inverse Discrete-Cosine Transform (IDCT). We often refer to both as DCT.
How does DCT work?
DCT takes as its input a mathematical function and figures out a way to represent it as a sum of known cosine functions. For JPEGs, DCT takes as input the brightness function of one of the image components (see Figure 4-7).
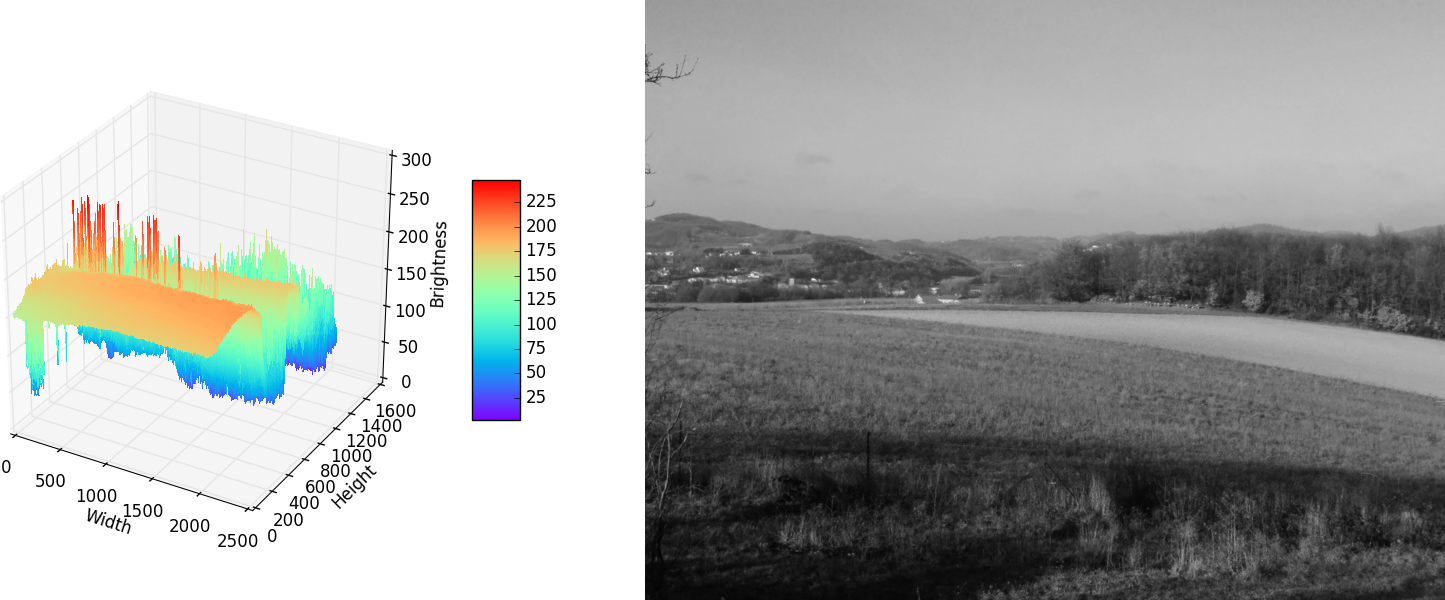
Figure 4-7. The Y component of an image, plotted as a 2D function
How does DCT do its magic?
DCT defines a set of basis functions: special cosine functions that are orthogonal to each other.
That means that:
-
There’s no way to represent any of the waveforms that these functions create as a sum of the other functions.
-
There’s only one way to represent an arbitrary 1D function (like sound waves or electrical currents) as the sum of the basis functions, multiplied by scalar coefficients.
This allows us to replace any n value vector by the list of n coefficients that can be applied to the basis functions to re-create the function’s values.
The DCT basis functions are ordered from the lowest frequency one to the left up to the highest frequency one to the right, as shown in Figure 4-8.
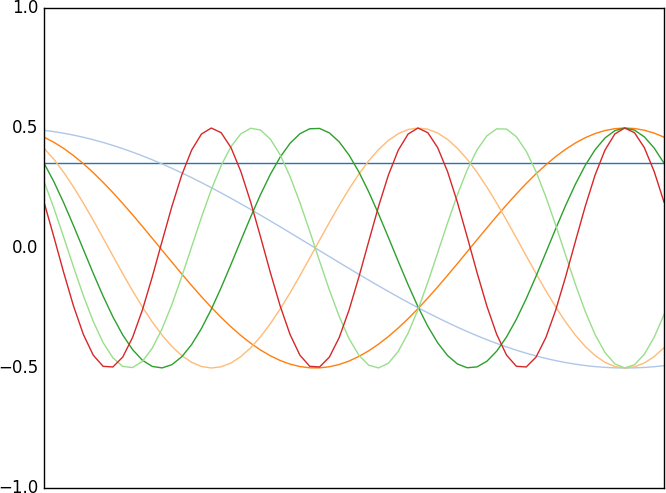
Figure 4-8. The basis functions of one-dimensional DCT
Each DCT value is a scalar multiplier of one of the basis functions. The first value, which correlates to the constant function we’ve seen earlier, is called the DC component, since when discussing electrical currents, that constant function represents the direct current part. All other values are called the AC components, since they represent the alternating current component.
The reason we’re using electrical terms such as DC and AC is that one-dimensional DCT is often used to represent electrical signals, such as analog audio signals.
While one-dimensional DCT is not very interesting in and of itself, when discussing images, we can extend the same concept to two-dimensional functions (such as the brightness function of an image). As our basis functions we can take the eight one-dimensional DCT functions we saw earlier and multiply them to get 8×8 basis functions. These functions can then be used in a very similar way to represent any arbitrary set of 8×8 values as a matrix of 8×8 coefficients of those basis functions (see Figure 4-9).
One small difference in image data with regard to audio waves or electrical currents is that our function’s possible output range is from 0 to 255, rather than having both positive and negative values. We can compensate for that difference by adding 128 to our function’s values.
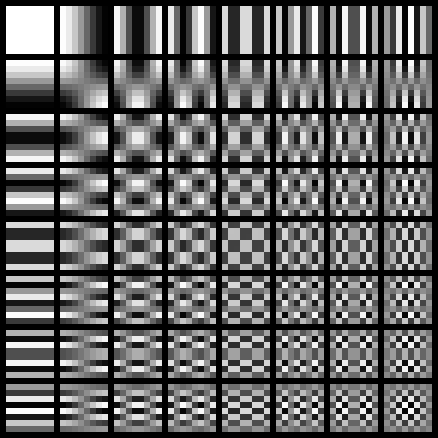
Figure 4-9. The multiplication of 1D DCT basis functions creates the following 8×8 matrix of 2D basis functions
As you can see in the upper-left corner, the first basis function is of constant value. That’s the two-dimensional equivalent of the DC component we’ve seen in one-dimensional DCT. The other basis functions, because they result from multiplying our one-dimensional basis functions, are of higher frequency the farther they are from that upper-left corner. That is illustrated in Figure 4-9 by the fact that their brightness values change more frequently.
Let’s take a look at the brightness values of a random 8×8-pixel block in Figure 4-10:
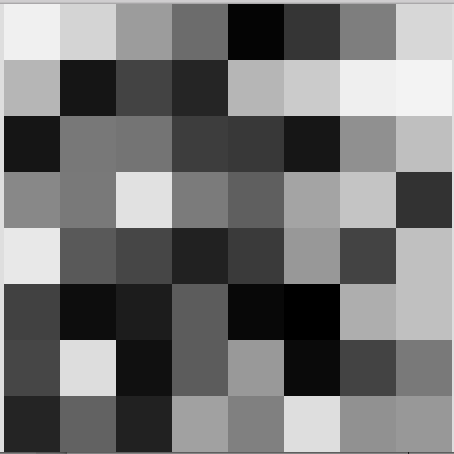
Figure 4-10. A random 8×8-pixel block
240   212   156  108    4   53   126   215
182    21    67   37  182  203   239   243
 21   120   116   61   56   22   144   191
136   121   225  123   95  164   196    50
232    89    70   33   58  152    67   192
 65    13    28   92    8    0   174   192
 70   221    16   92  153   10    67   121
 36    98    33  161  128  222   145   152
Since we want to convert it to DCT coefficients, the first step would be to center these values around 0, by substracting 128 from them. The result is:
 112   84   28   -20   -124   -75   -2   87
  54 -107  -61   -91     54    75  111  115
-107   -8  -12   -67    -72  -106   16   63
   8   -7   97   -5     -33    36   68  -78
 104  -39  -58  -95     -70    24  -61   64
 -63 -115 -100  -36    -120  -128   46   64
 -58   93 -112  -36      25  -118  -61   -7
 -92  -30  -95   33       0    94   17   24
Applying DCT on the preceding matrix results in:
-109 -114   189   -28   17    8   -20   -7
 109   33   115   -22  -30   50    77   79
  56  -25     0     3   38  -55   -60  -59
 -43   78   154   -24   86   25     8  -11
 108  110   -15    49  -58   37   100  -66
 -22  176   -42  -121  -66  -25  -108    5
 -95  -33    28  -145  -16   60   -22  -37
 -51   84    72   -35   46 -124   -12  -39
Now every cell in the preceding matrix is the scalar coefficient of the basis function of the corresponding cell. That means that the coefficient in the upper-left corner is the scalar of the constant basis function, and therefore it is our DC component. We can regard the DC component as the overall brightness/color of all the pixels in the 8×8 block. In fact, one of the fastest ways to produce a JPEG thumbnail that’s 1/8 of the original JPEG is to gather all DC components of that JPEG.
We’ve seen that the coefficient order corresponds with the basis function order, and also that the basis function frequency gets higher the farther we are in the right and downward directions of the matrix. That means that if we look at the frequency of the coefficients in that matrix, we would see that it increases as we get farther away from the upper-left corner.
Now, when serializing the coefficient matrix it’s a good idea to write the coefficients from the lowest frequency to the highest. We’ll further talk about the reasons in “Quantization”, but suffice it to say that it would be helpful for compression. We achieve that kind of serialization by following a zig-zag pattern, which makes sure that coefficients are added from the lowest frequency to the highest one (see Figure 4-11).
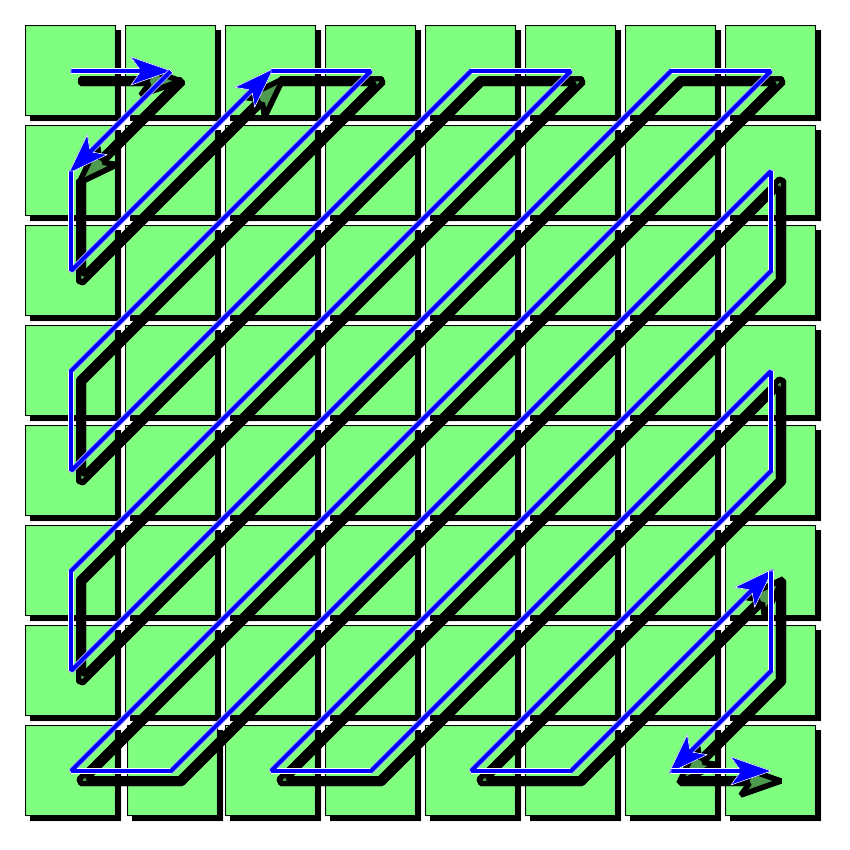
Figure 4-11. The zig-zag pattern used by JPEG to properly order lower-frequency components ahead of higher-frequency ones
Minimal coding units
So, we can apply DCT to any 8×8 block of pixel values. How does that apply to JPEG images that can be of arbitrary dimensions?
As part of the DCT process each image is broken up into 8×8-pixel blocks called MCUs, or minimal coding units. Each MCU undergoes DCT in an independent manner.
What happens when an image width or height doesn’t perfectly divide by eight? In such cases (which are quite common), the encoder adds a few extra pixels for padding. These pixels are not really visible when the image is decoded, but are present as part of the image data to make sure that DCT has an 8×8 block.
One of the visible effects of the independent 8×8 block compression is the “blocking” effect that JPEG images get when being compressed using harsh settings. Since each MCU gets its own “overall color,” the visual switch between MCUs can be jarring and mark the MCU barriers (see Figure 4-12).
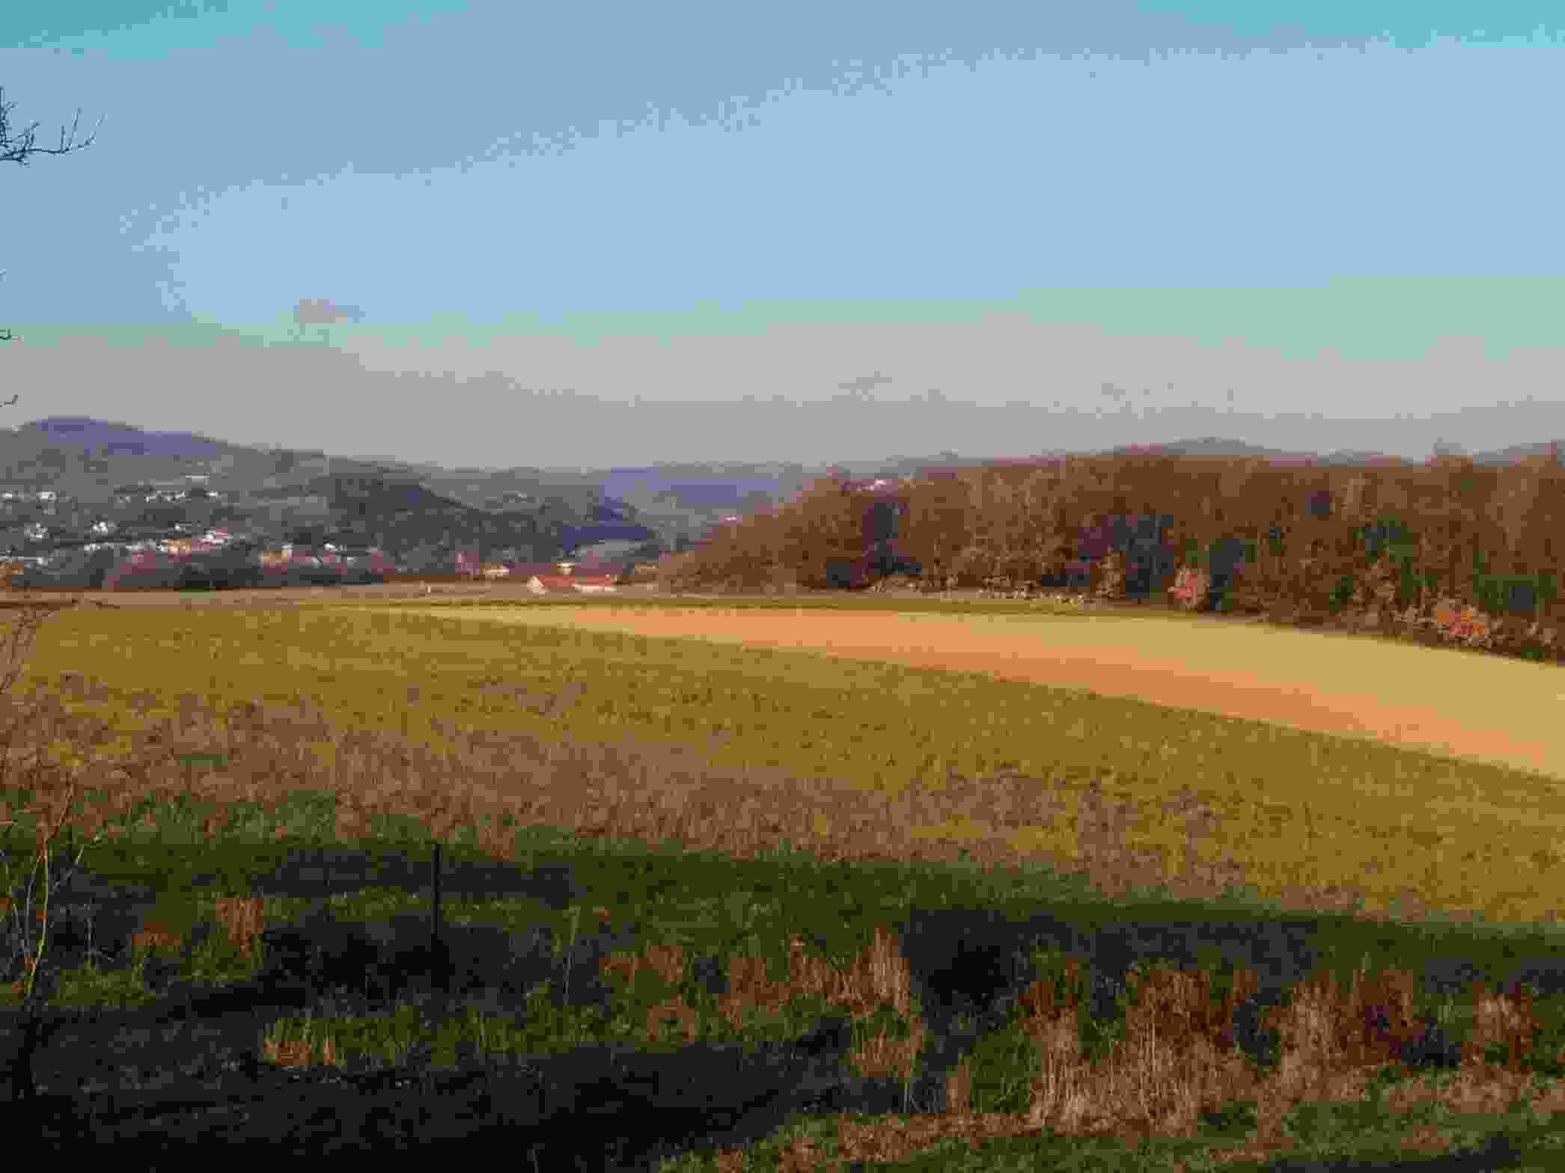
Figure 4-12. Earlier image of French countryside with rough compression settings; note the visible MCU blockiness
Quantization
Up until now, we’ve performed DCT, but we didn’t save much info. We replaced representing sixty-four 1-byte integer values with sixty-four 1-byte coefficients—nothing to write home about when it comes to data savings.
So, where do the savings come from? They come from a stage called quantization. This stage takes the aforementioned coefficients and divides them by a quantization matrix in order to reduce their value. That is the lossy part of the JPEG compression, the part where we discard some image data in order to reduce the overall size.
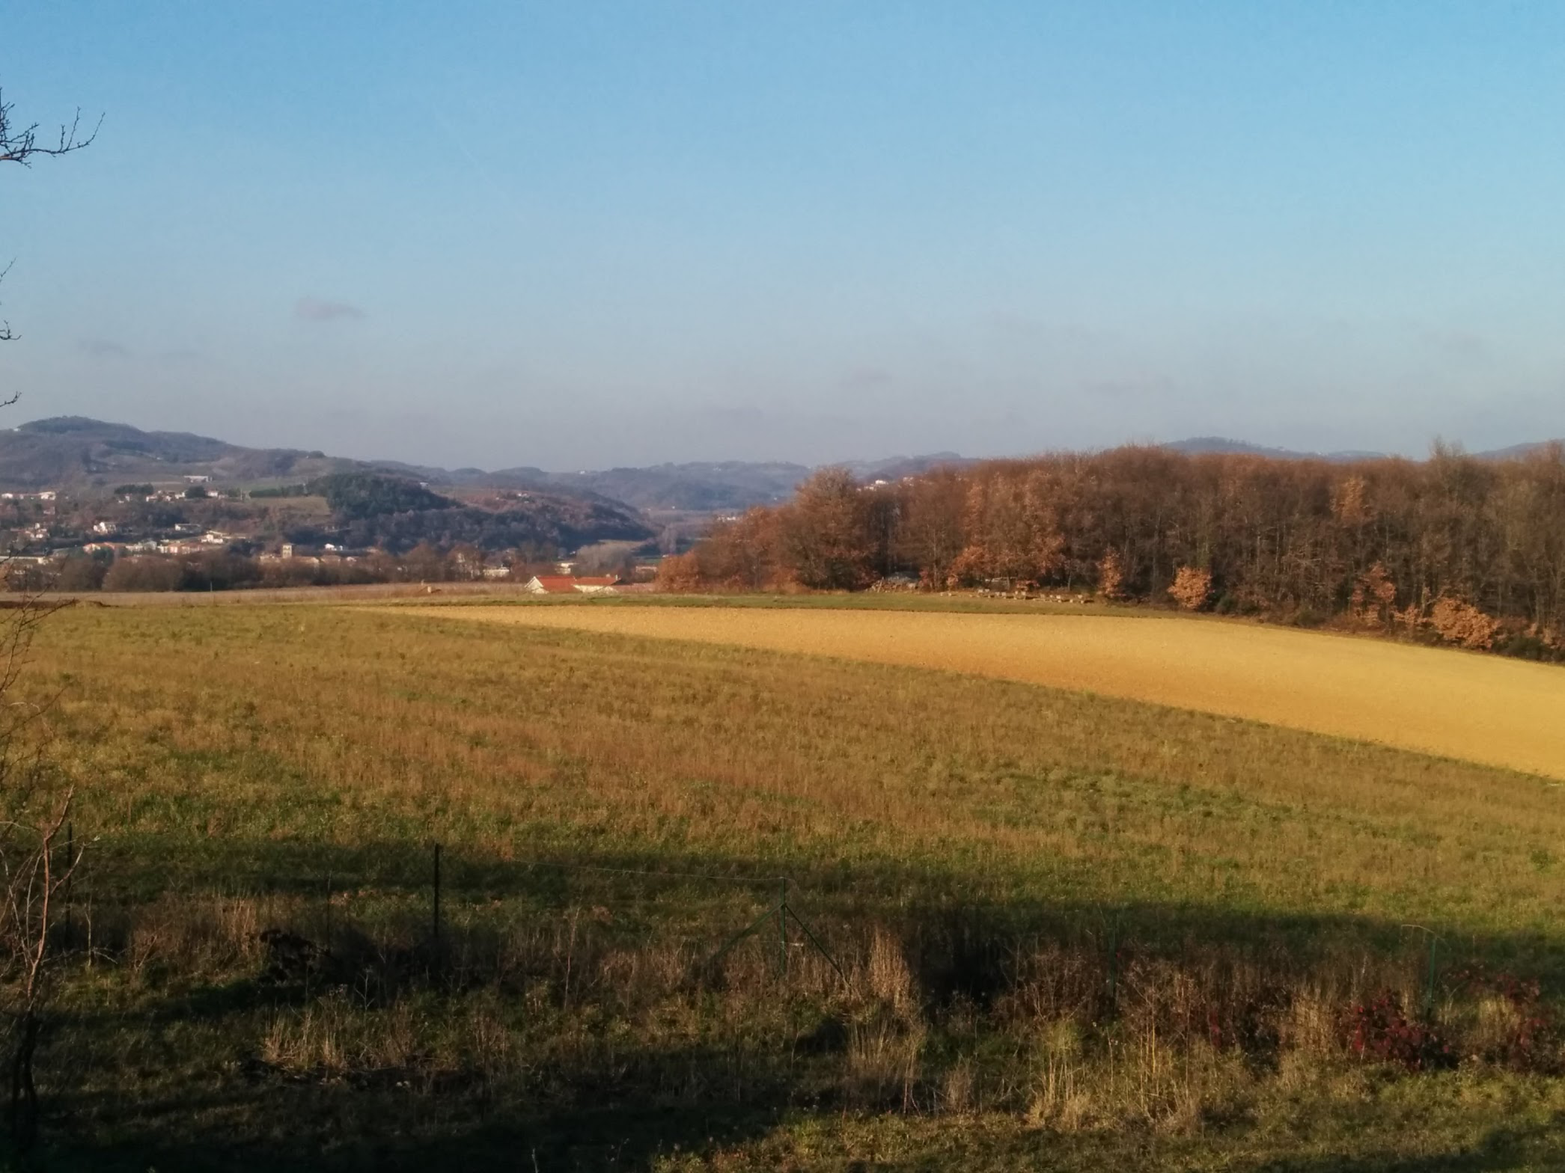
Figure 4-13. French countryside in winter
Let’s take a look at the quantization matrix of Figure 4-13:
 3    2    8    8    8    8    8    8
 2   10    8    8    8    8    8    8
10    8    8    8    8    8    8    8
 8    8    8    8    8    8    8    8
 8    8    8    8    8   10    9    8
 8    8    8    8    8    9   12    7
 8    8    8    8    9   12   12    8
 8    8    8    8   10    8    9    8
But that image is the original that was produced by the digital camera, and is quite large from a byte size perspective (roughly 380 KB). What would happen if we compress that JPEG with quality settings of 70 to be 256 KB, or roughly 32% smaller? See Figure 4-14.
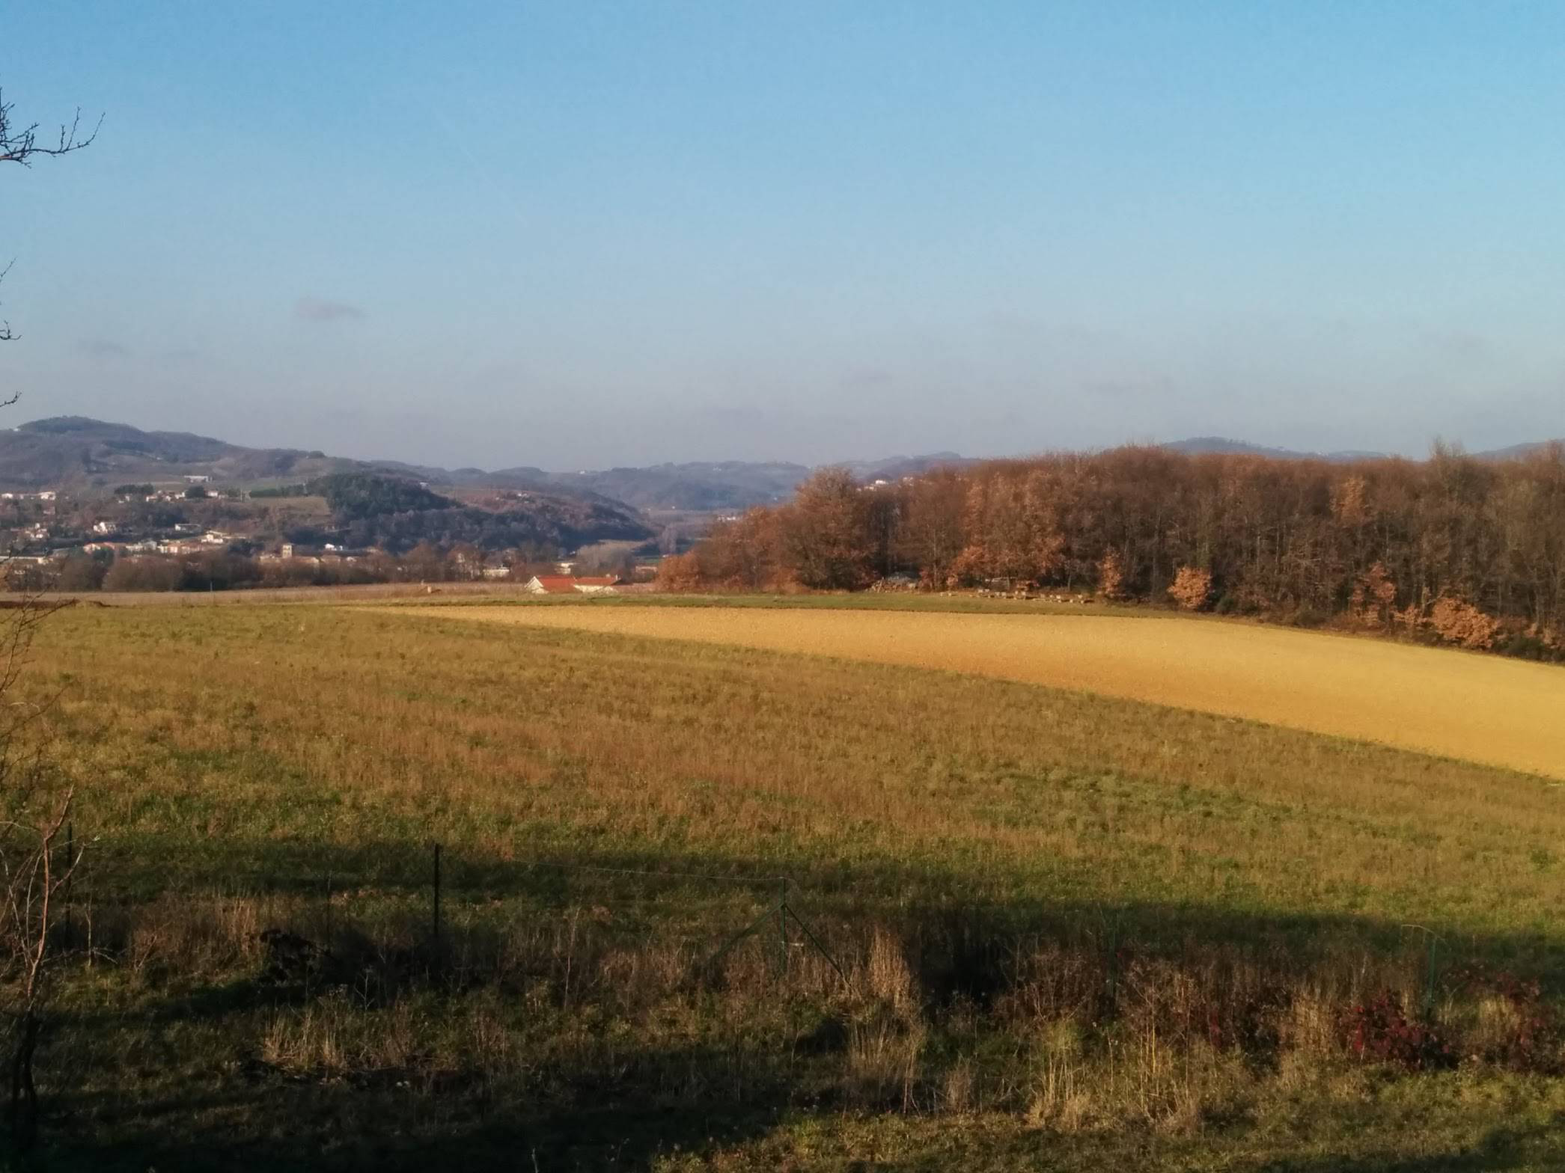
Figure 4-14. Same image with a quality setting of 70
And its quantization matrix?
10    7    6   10   14   24   31   37
 7    7    8   11   16   35   36   33
 8    8   10   14   24   34   41   34
 8   10   13   17   31   52   48   37
11   13   22   34   41   65   62   46
14   21   33   38   49   62   68   55
29   38   47   52   62   73   72   61
43   55   57   59   67   60   62   59
As you can see from the preceding quantization matrices, they have slightly larger values in the bottom-right corner than in the upper-left one. As we’ve seen, the bottom-right coefficients represent the higher-frequency coefficients. Dividing those by larger values means that more high-frequency coefficients will finish the quantization phase as a zero value coefficient. Also, in the q=70 version, since the dividers are almost eight times larger, a large chunk of the higher-frequency coefficients will end up discarded.
But, if we look the two images, the difference between them is not obvious. That’s part of the magic of quantization. It gets rid of data that we’re not likely to notice anyway. Well, up to a point at least.
Compression levels
Earlier we saw the same image, but compressed to a pulp. Wonder what the quantization matrix on that image looks like?
160  110  100  160  240  255  255  255
120  120  140  190  255  255  255  255
140  130  160  240  255  255  255  255
140  170  220  255  255  255  255  255
180  220  255  255  255  255  255  255
240  255  255  255  255  255  255  255
255  255  255  255  255  255  255  255
255  255  255  255  255  255  255  255
We can see that almost all frequencies beyond the first 20 are guaranteed to be quantified to 0 (as their corresponding quantization value is 255). And it’s even harsher in the quantization matrix used for the chroma components:
170  180  240  255  255  255  255  255
180  210  255  255  255  255  255  255
240  255  255  255  255  255  255  255
255  255  255  255  255  255  255  255
255  255  255  255  255  255  255  255
255  255  255  255  255  255  255  255
255  255  255  255  255  255  255  255
255  255  255  255  255  255  255  255
It is not surprising, then, that the image showed such blockiness. But what we got in return for that quality loss is an image that is 27 KB or 93% (!!!) smaller than the original. And you could well argue that the result is still recognizable.
Note that the compression level and quality settings of the different JPEG encoders mean that they pick different quantization matrices to compress the images. It’s also worth noting that there’s no standard for what quantization matrices should be picked and what quality levels actually mean in practice. So, a certain quality setting in one encoder can mean something completely different (and of higher/lower visible quality) when you’re using a different encoder.
One more thing of note is that encoders can (and often do) define a different quantization matrix for different components, so they can apply harsher quantization on the chroma components (which are less noticeable) than they would apply on the luma component.
Dropping zeros
How does zeroing out the coefficients help us better compress the image data? Since we are using a zig-zag pattern in order to sort the coefficients from lower frequency to high frequency, having multiple zero values at the end of our coefficient list is very easy to discard, resulting in great compression. JPEG further takes advantage of the fact that in many cases zero values tend to gather together, and adds a limited form of run-length encoding, which discards zeros and simply writes down the number of preceding zeros before nonzero values. The remaining values after quantization are also smaller numbers that are more amenable to entropy encoding, since there’s higher probability that these values are seen multiple times than a random 0–255 brightness value.
Dequantization
At the decoder, the reverse process happens. The quantified coefficients are multiplied by the values of the quantization matrix (which is sent to the decoder as part of the DQT marker) in a process called dequantization, which recontructs an array of coefficients. The accuracy of these coefficients versus the coefficients encoded varies based on the values of the quantization matrix. As we’ve seen, the larger these values are, the further are the dequantized coefficients from the original ones, which results in harsher compression.
Lossy by nature
It is important to note that quantization is a lossy process, and YCbCr color transformations may also be lossy depending on the implementation. That means that if we take a JPEG and compress it to the same quality (so, using the same quantization tables) over and over, we will see a significant quality loss after a while. Each time we encode a JPEG, we lose some quality compared to the original images. That’s something worth bearing in mind when constructing your image compression workflow.
Progressive JPEGs
Sequential JPEGs are JPEGs in which each MCU is sent in its entirety in a single scan. Such JPEGs can be decoded as they come, creating a partial image (Figure 4-15).
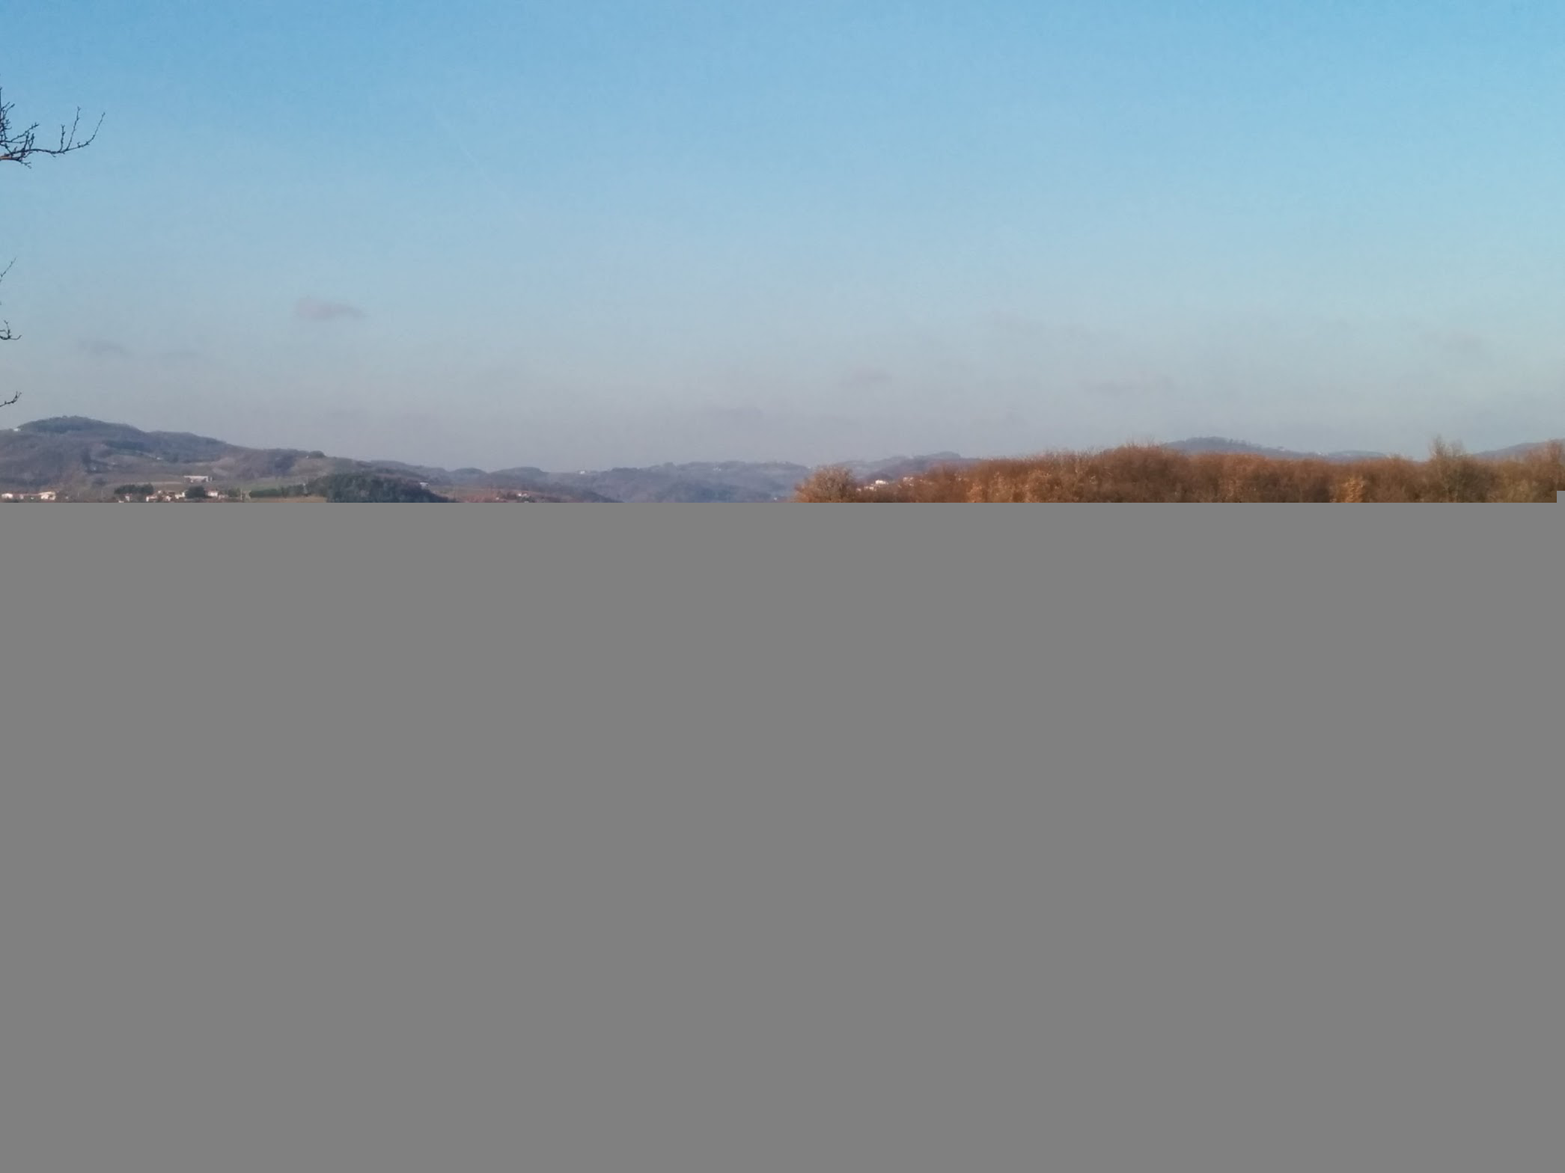
Figure 4-15. Image truncated after 60 KB of data
Progressive JPEGs, on the other hand, are JPEGs in which MCU data is sent over in multiple scans, enabling the decoder to start decoding an approximate image of the entire JPEG after receiving just one of the scans. Future scans further refine the image details. That enables supporting browsers to optimize the first impression of the user, without compromising the eventual image quality (see Figure 4-16).
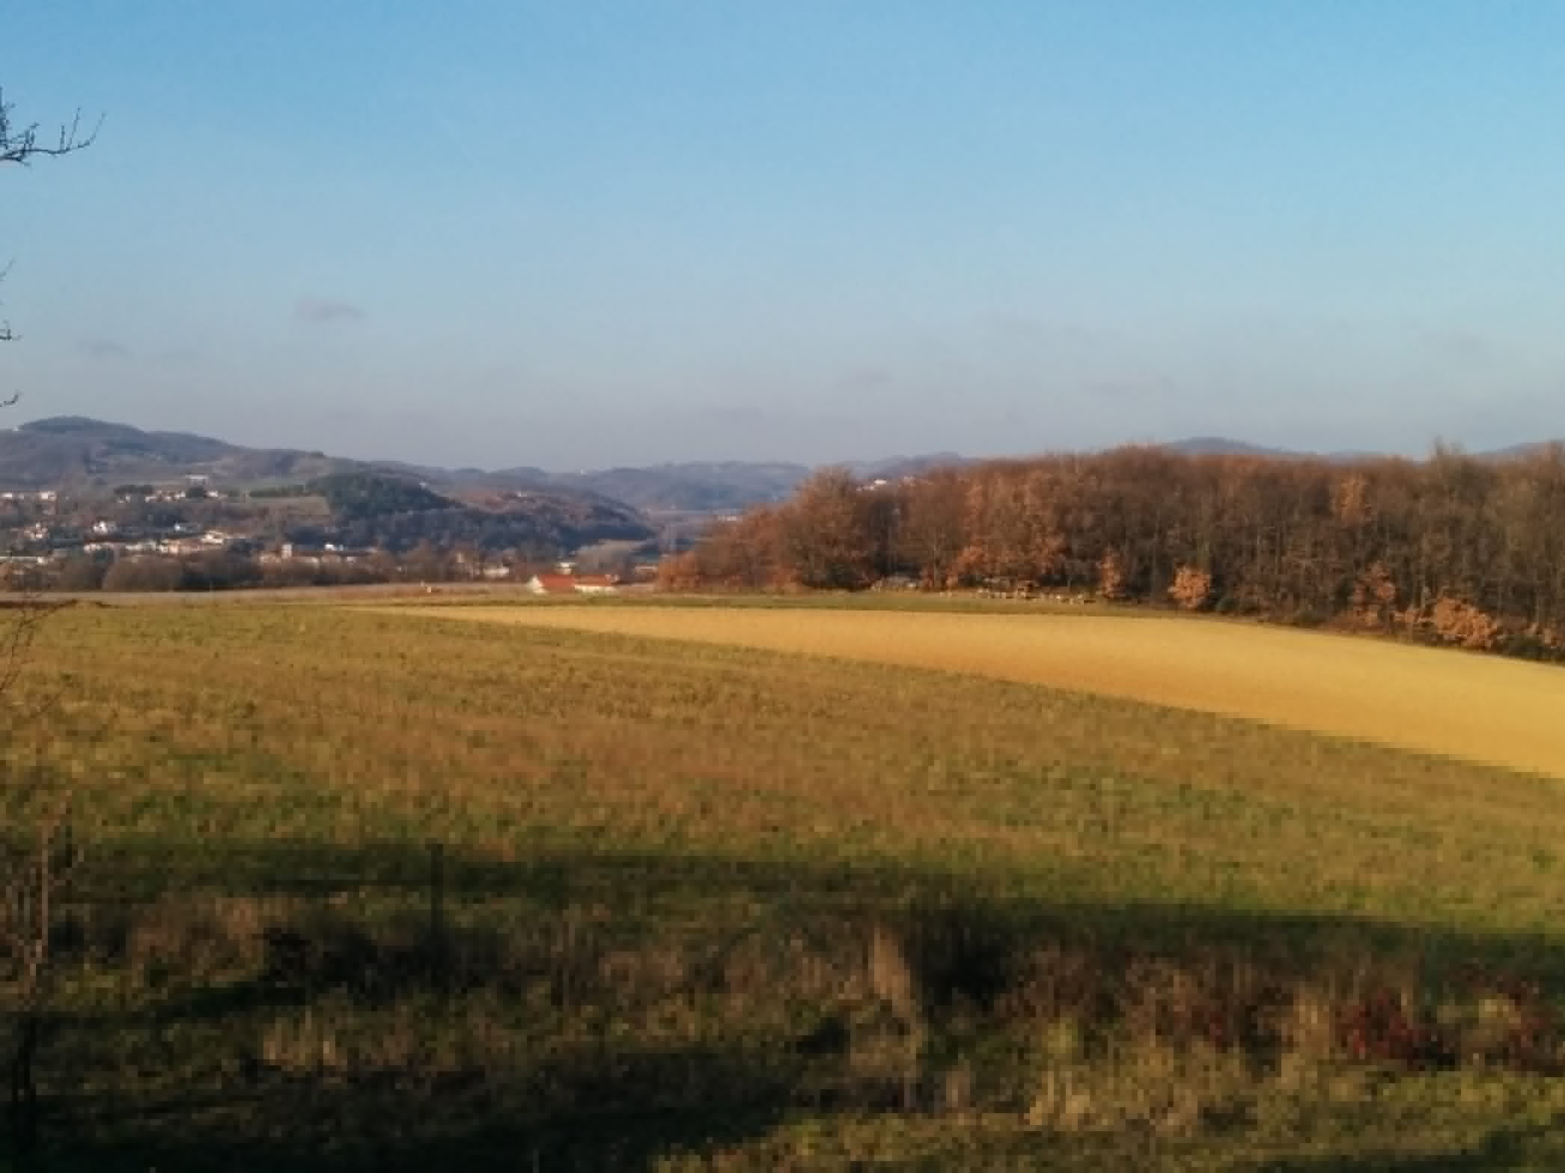
Figure 4-16. Image truncated after 60 KB of data using progressive mode
We can see that the image is not perfect, but it is fairly complete.
There are two forms of sending JPEG data progressively: spectral selection and successive approximation. Spectral selection means that the parts of the MCU data that are sent first are the low-frequency coefficients in their entirety, with the higher-frequency coefficients sent as part of a later scan. Successive approximation means that for each coefficient, its first few bits are sent as part of an early scan, while the rest of its bits are sent at a later scan.
These two methods are not mutually exclusive, and can be combined for ideal progressive results. Some coefficients are sent in their entirety, while others are sent over multiple scans.
One significant advantage of progressive JPEGs is that each scan can have its own dedicated Huffman table, which means that progressive JPEGs can have a higher compression ratio, as each part of the JPEG can have a highly optimal Huffman table.
It is worth noting that, as the popular saying goes, there’s more than one way to scan a JPEG. There’s a very large number of combinations for possible scans, differing from one another in the coefficients that get sent in their entirety and the coefficients that get sent progressively using successive approximation, as well as which components get sent first.
This allows us to squeeze some extra compression from JPEGs. Finding the ideal combination of progressive scans and their relative Huffman compression performance is a nontrivial problem. Fortunately, the search space is not huge, so smart encoders just brute-force their way to find it. That is the secret of the lossless optimizations performed by tools like jpegrescan, which are now integrated as part of MozJPEG (which we’ll soon discuss).
Unsupported Modes
The JPEG standard includes two more modes, but those are rarely supported by encoders and decoders, meaning they are rarely of practical use.
Hierarchical mode
Hierarchical operation mode is similar to progressive encoding, but with a significant difference. Instead of progressively increasing the quality of each MCU with each scan being decoded, the hierarchical mode enables progressively increasing the spatial resolution of the image with each scan.
That means that we can provide a low-resolution image and then add data to it to create a high-resolution image! Here’s how it works: the first scan is a low-resolution baseline image, while each following scan upsamples the previous scan to create a prediction basis upon which it builds. This way, each scan other than the first sends only the difference required to complete the full-resolution image.
Unfortunately, it is not very efficient compared to other JPEG modes. It is also limited in its utility, since upsampling can only be done by a factor of two.
Lossless mode
The lossless operation mode in JPEG is another rarely supported operation mode. It is quite different from the other operation modes in the fact that it doesn’t use DCT to perform its compression, but instead uses neighboring pixels–based prediction (called differential pulse code modulation, or DPCM) in order to anticipate the value of each pixel, and encodes only the difference between prediction and reality. Since the difference tends to be a smaller number, it is more susceptible to entropy coding, resulting in smaller images compared to the original bitmap (but still significantly larger than lossy, DCT-based JPEGs).
JPEG Optimizations
As we’ve seen in Chapter 2, lossy image formats such as JPEG (ignoring its irrelevant lossless mode of operation) can undergo both lossy and lossless types of compression. In this section we’ll explore various optimization techniques that are often used to reduce the size of JPEG images.
Lossy
As far as lossy optimization, JPEG images can be optimized by undergoing the regular DCT-based high-frequency reduction, only with more aggressive quantization tables. Quantization tables with higher numeric values lead to higher loss of high-frequency brightness changes, resulting in smaller files with more visible quality loss.
Therefore, a common way to optimize JPEGs is to decompress them and then recompress them with lower “quality” values (which translate into higher numeric value quantization tables).
Lossless
There are multiple ways to losslessly optimize a JPEG:
-
Optimize its Huffman tables for current scans.
-
Rescan it, in order to achieve the ideal combination of progressive JPEG scans and Huffman tables.
-
Remove nonphotographic data such as EXIF metadata.
We already discussed the first two when we talked about Huffman tables and progressive JPEGs, so we’ll expand on the third here.
EXIF metadata is added to JPEGs by most, if not all, modern digital cameras and by some photo editing software. It contains information regarding when and where the image was taken, what the camera settings were, copyright, and more. It may also contain a thumbnail of the image, so that a preview image can be easily displayed.
However, when you’re delivering images on the Web, all that info (perhaps besides copyright information) is not really relevant. The browser doesn’t need that information and can display the image just fine without it. Furthermore, users cannot access that information unless they explicitly download the image to look for it (and disregarding very specific and niche use cases, they would not care about it).
Also, as we saw earlier, that metadata may appear in the JPEG before the information regarding the JPEG dimensions, which can lead to delays in the time it takes the browser to learn what the image dimensions are, and can result in a “bouncy” (or “bouncier”) layout process.
So, it makes good sense to remove this metadata from web-served images. There are many software utilities that enable you to do that, and we’ll further discuss them in Chapter 14.
You should note that EXIF data may also contain orientation information that in some cases can alter the orientation of the image when it’s displayed in the browser. At least today, most browsers (with the notable exception of mobile Safari) ignore orientation information for images that are embedded in the document (either content images or background images), but they respect it when the user navigates directly to the image. Firefox also respects
orientation information when an (experimental) CSS property called image-orientation indicates that it should.
Therefore, dropping orientation info can cause user confusion or content breakage in various scenarios. It is advisable to maintain it intact when processing JPEGs.
MozJPEG
We already mentioned that JPEG has been around for a long while, and JPEG encoders have existed for just as long. As a result, many of them have not been updated with new features and improvements in recent years. At the same time, various browser-specific image formats (which we’ll discuss in the next chapter) were sparking interest in image compression and since their encoders were being written from scratch, they included more recent algorithms, which presented a non-negligable part of the reason these formats performed better than JPEG.
Mozilla, reluctant to introduce support for these newer formats, decided to start improving JPEG’s encoding and bring it up to the current state of the art, so that we can at least compare the different formats on a level playing field.
Hence they started the MozJPEG project, with the goal of increasing JPEG’s compression performance and creating smaller, similar quality files compared to other encoders, without hurting JPEG’s compatibility with all existing browsers. In order to reduce unnecesary development, and increase compatibility with existing image compression workflow, the project is a fork of the libjpeg-turbo project and a drop-in replacement of it in terms of binary interface.
The project uses various encoding optimizations to achieve improved compression rates:
-
Lossless compression based on ideal progressive scan patterns that produce smaller files
-
Trellis quantization, an algorithm that enables the encoder to pick better adapted quantization coefficients, in order to minimize image distortion for the current image
-
Quality tuning based on visual metrics, such as SSIM
-
Deringing of black text over white background
-
And more
Summary
In this chapter we looked into how JPEGs are constructed, which methods they use in order to achieve their impressive compression ratios, and how they can be optimized further.
Practical takeaways of this chapter include:
-
Progressive JPEGs can show the full image in lower quality sooner, providing a better user experience than sequential JPEGs.
-
Progressive JPEGs can have a smaller byte size than sequential ones.
-
JPEG encoders’ quality metric is often only an indication of the quantization table used, and its impact on various images may vary greatly.
-
Lossless optimization, such as EXIF removal, can have significant implications on byte size as well as the browser’s ability to calculate the image’s layout as early as possible.
-
Chroma subsampling can significantly reduce the size of JPEG’s color components.
-
JPEG compression is a lossy process, and each consecutive reencoding results in some quality loss.
-
If you have an image compression workflow that’s producing JPEGs, MozJPEG should probably be a part of it.
In the next chapter we will see how other, newer image formats are taking similiar methods further (by incorporating algorithmic knowledge that the compression industry has accumulated since 1992) to accomplish even better compression ratios.
Get High Performance Images now with the O’Reilly learning platform.
O’Reilly members experience books, live events, courses curated by job role, and more from O’Reilly and nearly 200 top publishers.

