208 IBM Enterprise Workload Manager
Diagnosis
Possible causes of this problem are the following:
EWLM Control Center is supported on IE V6 SP1. If you are on a previous version, it may
work, but you may have intermittent problems.
You need to enable cookies.
You need to enable Javascript.
Do not set security to the maximum on IE because this renders your login unsuccessful.
You need a JVM plug-in to display graphs.
The EWLM Control Center uses SSL/TLS for communications.
Solution
We recommend you scan your computer and install all critical Internet Explorer updates.
For example, from Internet Explorer, choose Tools
→ Windows Update. This will take
you to the Microsoft Window Update internet site. Click Scan for updates. Apply the
latest critical updates, including KB831167, which is needed to allow a valid userid to log
in without first waiting one full minute after presentation of the login page.
You need to set the security in your browser to use TLS. To do this follow these steps:
a. In IE, click Tools
→ Internet Options → Advanced.
b. Scroll down to Security and select Use TLS 1.0.
c. Click OK.
8.6.2 Manage options
Problem
Communication error
Error received
See “Problems with the managed servers” on page 205.
8.6.3 Monitor options
Problem
Application topology window does not show expected results.
Error received
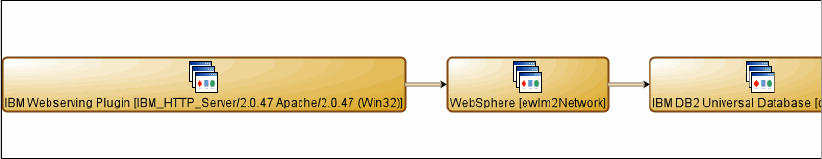
The Application topology for our transaction class did not show our entire topology. The
Application Topology window should have looked similar to Figure 8-2 since we had an HTTP
Server as hop 0, two WebSphere Application Servers as hop 1, and the DB2 Universal
Database as hop 2 in our configuration. However, when we selected Application Topology
from the pull-down list from the Monitor
→ Transaction Class selection, we got a view that
looked either like Figure 8-3 (missing the DB2 hop) or Figure 8-4 (missing the HTTP hop).
Figure 8-2 Correct Application Topology view
Chapter 8. Troubleshooting and diagnostics 209
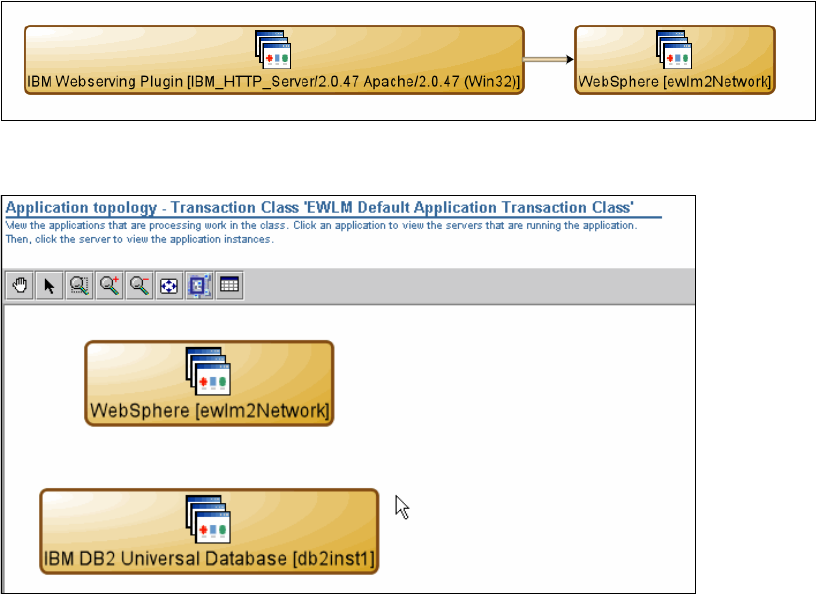
Figure 8-3 Broken Application Topology view 1
Figure 8-4 Broken Application Topology view 2
Expanded description
In our configuration, we have an HTTP Server (hop 0), two WebSphere Application Servers
(hop 1), and a DB2 database (hop 2). In the Enterprise Workload Manager Control Center,
under the Monitor option, we clicked Transaction classes, selected our transaction class,
clicked the pull-down, and chose Application Topology. We expected to see a chart in the
Application Topology view that looked like Figure 8-2, but one of the WebSphere Application
Servers and the DB2 were not there.
Since neither the WebSphere Application Server nor the DB2 were set up in a special
transaction class, they showed up as hop 0s in the EWLM Default Application Transaction
Class, as shown in Figure 8-4.
Diagnosis and solution
There are a number of reasons that this scenario may occur:
1. Managed server-related
The managed server was not started on the machine where the application was running.
2. DB2-related
The DB2 Universal JDBC driver supports JDBC type 2 and type 4. Since we were testing
the trade3 installation script, it was using the legacy DB2 JDBC driver in type 2 mode by
default (db2java.zip). The legacy driver does not propagate the ARM correlator to the next
hop, so we installed the new JCC driver in type 4 mode.
To verify that instrumentation has been set up correctly on AIX, issue the lsarm -a
command. You should see:
APPL: IBM DB2 Universal Database
Get IBM Enterprise Workload Manager Release 1 now with the O’Reilly learning platform.
O’Reilly members experience books, live events, courses curated by job role, and more from O’Reilly and nearly 200 top publishers.

