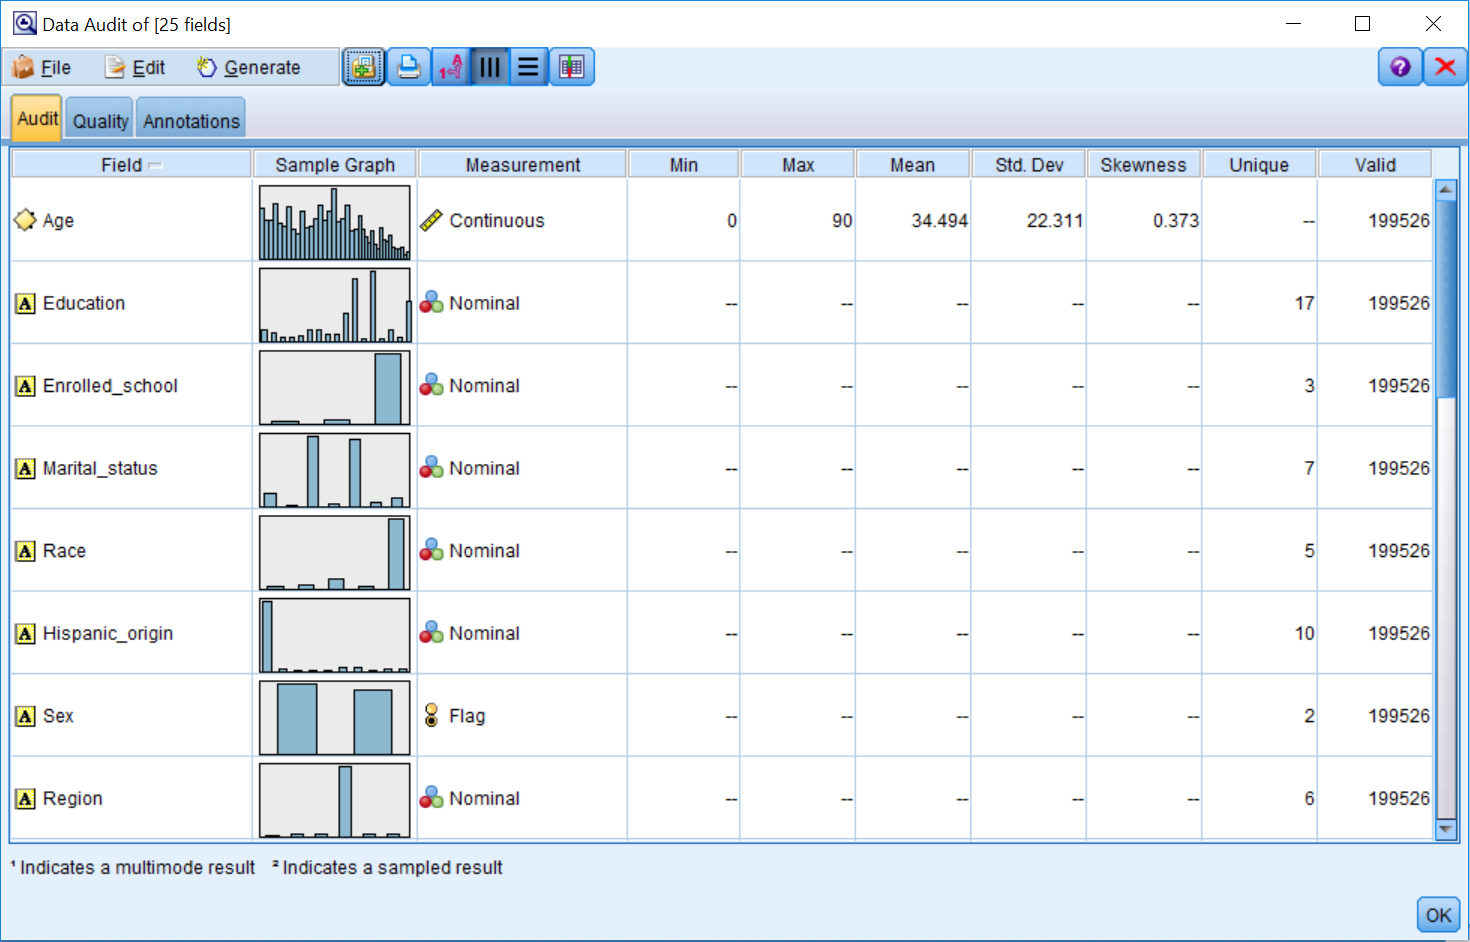
Each row of the Audit tab of the Data Audit output represents a field, and the columns contain graphs, measurement level information, and summary statistics. The Data Audit node reports different statistics and graphs depending on the measurement level of the fields. This is one of the reasons why it is important to set the correct measurement level before running the Data Audit node:

For Categorical fields, the Data Audit node reports the number of unique values, which is the number of unique categories. For Continuous fields, the Data Audit node reports on the Min (minimum), Max (maximum), Mean, standard deviation ...

