
Chapter 6. Monitor implementation and operation 147
Figure 6-13 UDP endpoint throughput and traffic
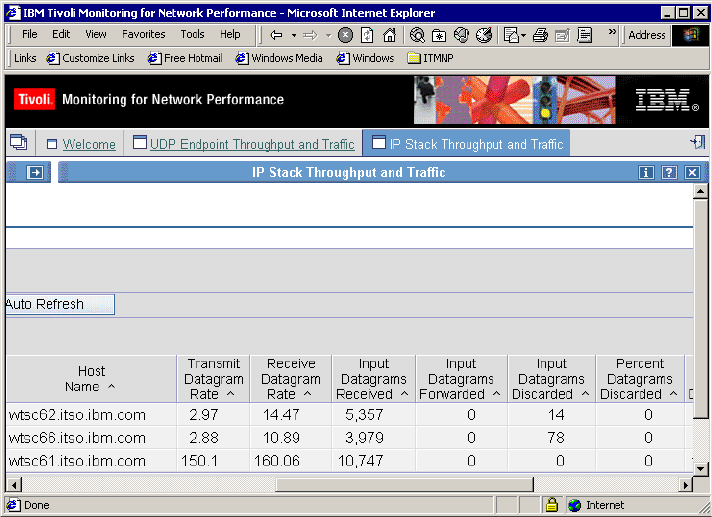
For the IP protocol, the IBM Tivoli Monitoring for Network Performance has only
one panel, which contains information about the manipulated datagrams for each
one of the systems being monitored. Figure 6-14 on page 148 shows an example
of this situation.
148 IBM Tivoli Monitoring for Network Performance V2.1: The Mainframe Network Management Solution
Figure 6-14 IP stack throughput and traffic
Monitoring applications
Most of the applications running on a z/OS system support the TCP/IP protocol
on some level. Each one has its own application specific protocol built under the
TCP/IP protocol. For example, for terminal emulation, we have the UNIX Telnet
protocol and the TN3270 protocol. For file transfer, we have the FTP protocol,
and for Web applications, we have the HTTP protocol. Those are well-known
TCP/IP application protocols, but there are many others.
Each one of these protocols is identified by the TCP/IP stack by ports. Each port
will be listening, or accepting connections, to a specific application protocol, so
there will be a specific address space listening on a specific port.
It is possible to have the same address space listening on more than one port at
the same time, like the HTTP Server for normal and SSL connections. The
TN3270 server can have 256 different ports at the same time for normal and SSL
connections.
The IBM Tivoli Monitoring for Network Performance cannot understand what is
happening within the application protocol, but it can monitor the application
Chapter 6. Monitor implementation and operation 149
behavior in terms of the number of active connections, the number of
connections accepted, bytes sent and received, and so on.
For the TN3270 and FTP applications there are a special set of pages show
specific information for those two application protocols.
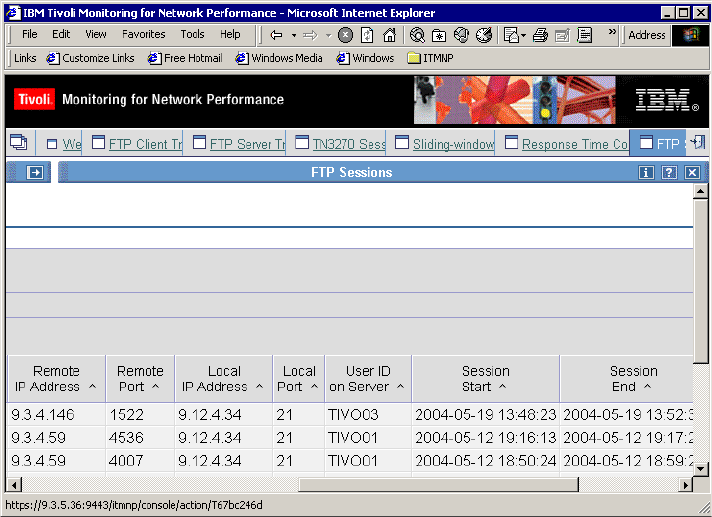
For the FTP applications, there are three different pages:
The active FTP sessions page shows, on a specific time, all server and client
sessions from the z/OS images. As an example, see Figure 6-15.
Figure 6-15 FTP sessions
The z/OS FTP client transfer records page shows only the information about
client sessions started from a z/OS system to a remote FTP server.
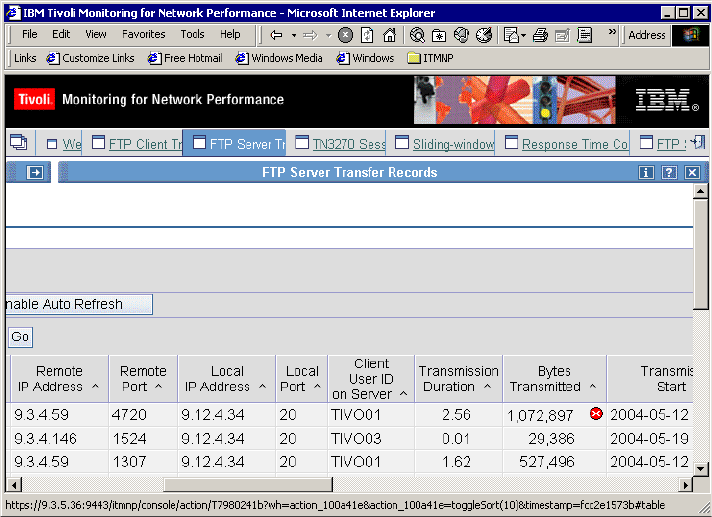
The z/OS FTP server transfer records page show remote clients connections
to a z/OS local FTP server. This page shows complete information about file
transmissions that occurred on a specific period and can be used, for
example, to monitor the activity of specific users. See Figure 6-16 on
page 150.
150 IBM Tivoli Monitoring for Network Performance V2.1: The Mainframe Network Management Solution
Figure 6-16 FTP server transfer records
The TN3270 application is one of the most popular TCP applications running on
z/OS systems. There are three pages showing the TN3270 information:
The TN3270 server session availability page shows all TN3270 remote clients
connected to a TN3270 server running on a z/OS image. Each one of the
records will show a complete TN2370 session. As an example, it will show the
start time, end time, local and remote IP addresses and ports, and the
number of transmitted bytes in a specific TN3270 session.
The TN3270 sliding-window average response time page shows the
response time for the IP and SNA portions of a TN3270 session. This will only
work on z/S V1.5 systems or later when selecting the option to collect the
TN3270 performance data on monitor definition.
The TN3270 response time counts by time bucket page shows the number of
times a response times fits in each response time interval (the buckets). This
only works on z/OS V1.5 systems or later when selecting the option to collect
the TN3270 performance data on monitor definition.
Get IBM Tivoli Monitoring for Network Performance V2.1 The Mainframe Network Management Solution now with the O’Reilly learning platform.
O’Reilly members experience books, live events, courses curated by job role, and more from O’Reilly and nearly 200 top publishers.

