20Amount of Evidence
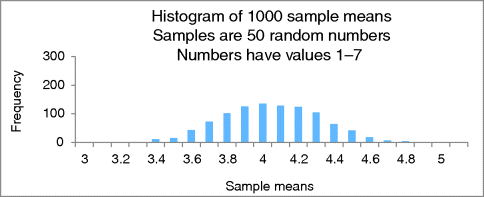
The original histogram, reproduced in Figure 20.1, shows the distribution of random sample means for a sample size of 50.

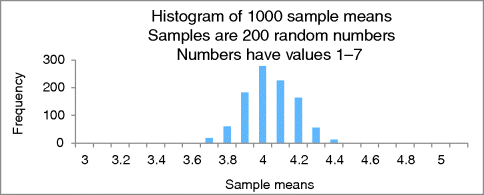
Figure 20.2 is a histogram showing the distribution of sample means when sample size is 200. Like before, we use random integers 1–7. Notice that it is more compact.

Analogous to what we saw with sample proportions:
As we'll see, the uncertainty due to sample size ![]() is incorporated into various statistical formulas involving sample means.
is incorporated into various statistical formulas involving sample means.
Note
Get Illuminating Statistical Analysis Using Scenarios and Simulations now with the O’Reilly learning platform.
O’Reilly members experience books, live events, courses curated by job role, and more from O’Reilly and nearly 200 top publishers.

