21Variance of Evidence
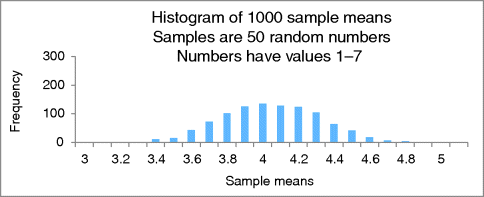
The original histogram, reproduced in Figure 21.1, shows the distribution of random sample means for a sample size of 50 when data values are 1–7.

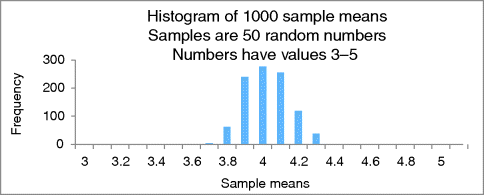
Figure 21.2 is a histogram of sample means with random samples of the same size but the data only take on the values 3–5. The resulting distribution is more compact.

Analogous to what we saw with sample proportions:
Recall that a key statistic to summarize variety is appropriately named the variance. And for a sample it is sample variance. Expressed in words, the sample variance of scaled data is the average squared distance of the sample values from the sample mean. It captures how spread out a sample's data values are.
To get the sample variance, we do the following: For each sample value, subtract the sample mean from it and square the difference; add the result to a running total. Note that we have to square the distances to make them all positive, otherwise the positive and negative distances would ...
Get Illuminating Statistical Analysis Using Scenarios and Simulations now with the O’Reilly learning platform.
O’Reilly members experience books, live events, courses curated by job role, and more from O’Reilly and nearly 200 top publishers.

