56For Part I
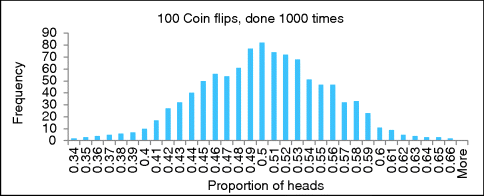
(A) Figure 56.1 is a histogram showing the results of 1000 repetitions of flipping a fair coin 100 times. The results are the number of times the 100 flips came up with various proportions of heads. Does this look approximately like a normal distribution? Eyeballing this histogram, what is the approximate 95% confidence interval for a fair coin? What is the approximate 99% confidence interval?

Answer: Yes, it approximates a normal distribution. It looks like about 950 of the 1000 proportions (95%) are in the interval 0.4–0.6. About 50 (5%) of the results have proportions outside this interval, with about 25 (2.5%) on each side (in each tail). Also, although it is hard to eyeball, about 990 of the 1000 proportions (99%) are betwen about 0.37 and about 0.63 inclusive, with about 5 (0.5%) in each tail outside this interval. (Simulating 10,000 repetitions would be better.)
(B) Looking at Table 56.1, check whether your eyeballed 95% confidence interval matches the theoretical results one should obtain when flipping fair coins 100 times. (Recall that the margin of error is the half-width of the 95% confidence interval and can be expressed as a percentage rather than a proportion.)
| Sample size | 100 | 500 | 1000 | 1500 |
| Margin of error (%) | ±9.80 | ±4.38 | ±3.10 | ±2.53 |
Answer: Yes, it does. 50% ± 9.8% is about 40–60%, or 0.4–0.6 proportions.
(C) ...
Get Illuminating Statistical Analysis Using Scenarios and Simulations now with the O’Reilly learning platform.
O’Reilly members experience books, live events, courses curated by job role, and more from O’Reilly and nearly 200 top publishers.

