57For Part II
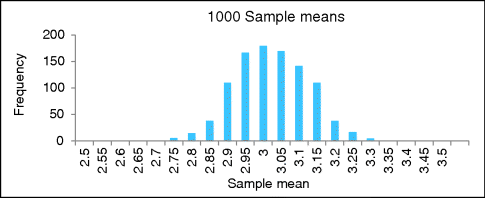
(A) Figure 57.1 is a simulation histogram of 1000 sample means. The samples come from a population with an unknown mean and variance. Does this look approximately like a normal distribution? What is your best rough estimate for the population mean?

Answer: Yes, it approximates a normal distribution. The unknown population mean is most likely close to 3.
(B) What interval holds about 95% of the results?
Answer: Between about 2.8 and 3.2. About 25 of the sample means are less than or equal to 2.8, and about 25 are greater than 3.2. (Remember that with a histogram, each bar is the count of the sample means that are less than or equal to (≤) the number label for the bar itself and strictly greater than (>) the number label for the bar to the left.)
(C) So what does the standard error equal, approximately?
Answer: Since about two (1.96 rounded) standard errors on each side of 3 will hold 95% of the sample means (since it approximates a normal distribution), and the interval is about 3.0 ± 0.2, the standard error should equal about ![]() .
.
(D) Figure 57.2 is a simulation histogram of 1000 sample mean differences. What is your best estimate for the difference between the actual population means?
Answer: About 0.5
(E) What interval holds ...
Get Illuminating Statistical Analysis Using Scenarios and Simulations now with the O’Reilly learning platform.
O’Reilly members experience books, live events, courses curated by job role, and more from O’Reilly and nearly 200 top publishers.

