Using wizards to build dashboards
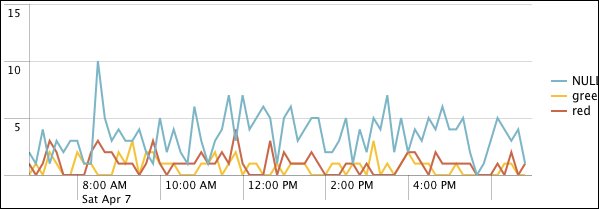
Using some of the queries from previous chapters, let's make an operational dashboard for errors occurring in our infrastructure. We will start by making a query (note that this query relies on the loglevel fields we created in Chapter 3, Tables, Charts, and Fields):
sourcetype="impl_splunk_gen" loglevel=error | timechart count as "Error count" by network
This will produce a graph like this one:

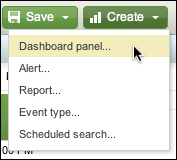
To add this to a dashboard, we perform the following steps:
- Choose Create | Dashboard panel….

- This opens a wizard interface that ...
Get Implementing Splunk: Big Data Reporting and Development for Operational Intelligence now with the O’Reilly learning platform.
O’Reilly members experience books, live events, courses curated by job role, and more from O’Reilly and nearly 200 top publishers.

