4.3 Identifying Points on a Graph
Consider a new file, CARS.MTW, to demonstrate Minitab possibilities to identify points on graphs.
| Column | Variable |
| C1 | Maker |
| C2 | Model |
| C3 | Price (in Euros) |
| C4 | Number of cylinders |
| C5 | Displacement (cc) |
| C6 | Power (CV) |
| C7 | Length (cm) |
| C8 | Width (cm) |
| C9 | Height (cm) |
| C10 | Luggage capacity (litres) |
| C11 | Weight (kg) |
| C12 | Consumption (litrs/100 km) |
| C13 | Maximum speed (km/h) |
| C14 | Acceleration (seconds going from 0 to 100 km/h) |
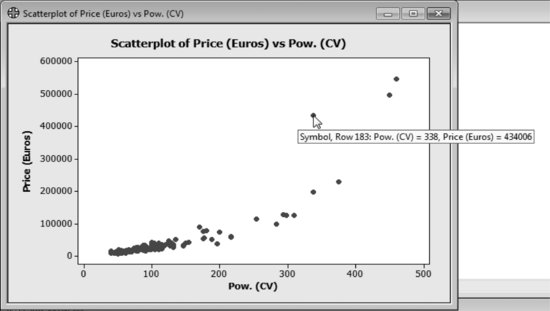
Plotting price(Y) with respect to power(X):

A simple way to identify cars with high prices in relation to their power consists on placing the cursor over the dots corresponding to observed high prices. Indeed, if you do so, after a while a small information box appears containing the row number corresponding to the data point together with its respective Y and X values.
Alternatively, you can identify points on a graph using: Editor > Brush. This will open up a small box containing the row-numbers corresponding to the marked data points. It is possible to mark a single ...
Get Industrial Statistics with Minitab now with the O’Reilly learning platform.
O’Reilly members experience books, live events, courses curated by job role, and more from O’Reilly and nearly 200 top publishers.

