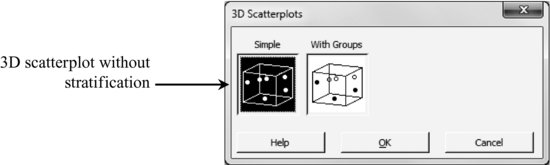
5.1 3D Scatterplots
Graph > 3D Scatterplot
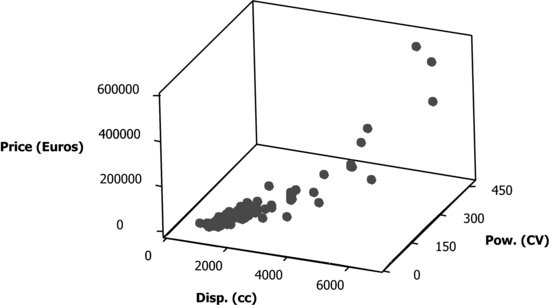
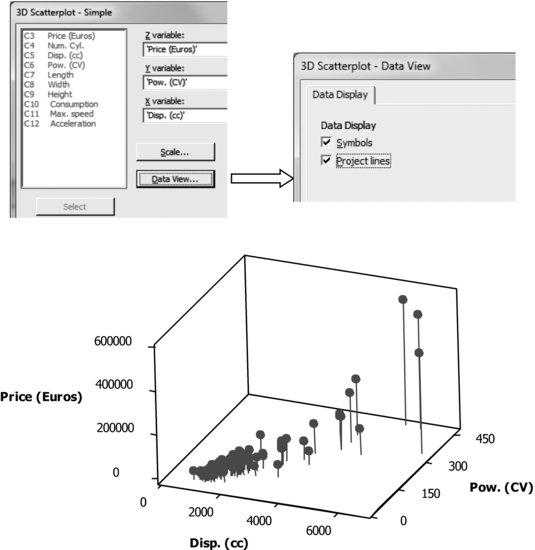
Enter the price in Z variable; power in Y variable, and displacement in X variable. Using default options we obtain:
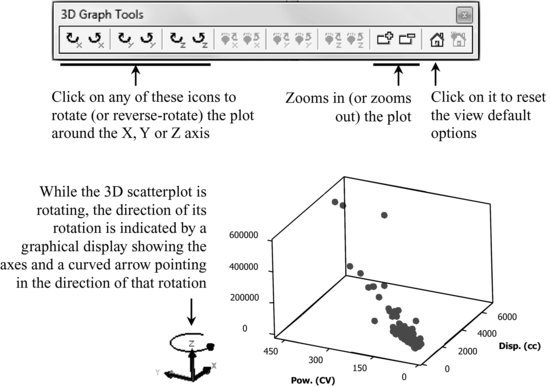
Notice that when the graph window opens, so also does the toolbar 3D Graph Tools, which allows the graph to be acted on interactively.
The properties of the graph can be modified by double clicking on the item you want to change (points, axes, …).
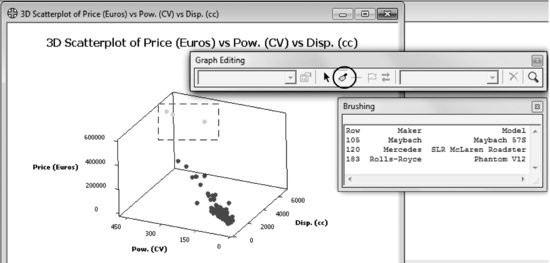
The Brush option can also be used in 3D scatterplots. To activate it, click on the indicated icon in the Graph Editing toolbar.
At times, it may be useful to draw lines joining each data point to its base. To do so, when constructing the graph, check the option Project lines in Data Display.
5.1.1 Stratification
Graph > 3D Scatterplot
The dialog box is similar to the previous case (without stratification), ...
Get Industrial Statistics with Minitab now with the O’Reilly learning platform.
O’Reilly members experience books, live events, courses curated by job role, and more from O’Reilly and nearly 200 top publishers.

