6.2 Copper
- Do the data confirm the suspicions that the content of P, the content of Pb or the shift influence the breaks?
- Has the process been stable during the four data collection weeks?
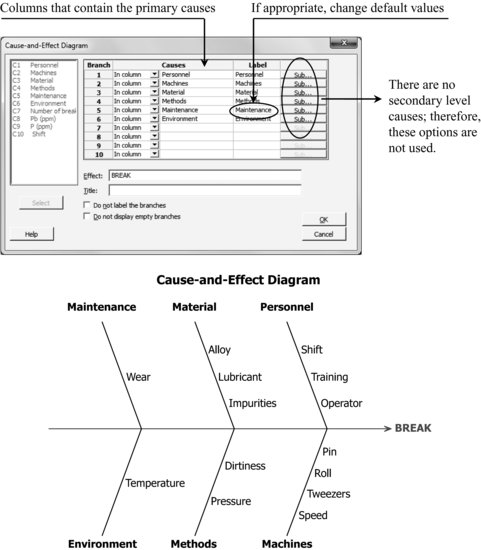
To construct the corresponding cause-and-effect diagram, proceed as follows.
Stat > Quality Tools > Cause-and-Effect

Get Industrial Statistics with Minitab now with the O’Reilly learning platform.
O’Reilly members experience books, live events, courses curated by job role, and more from O’Reilly and nearly 200 top publishers.

