7.3 Random Number Generation
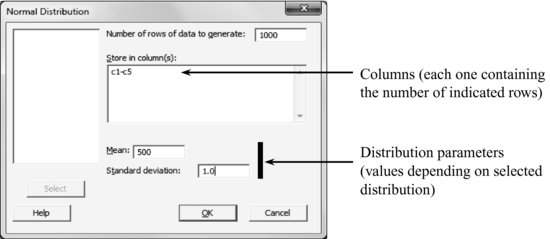
Calc > Random Data > [Probability distribution of interest]
If we want to generate 1000 values from a normal distribution with μ = 500 and σ = 5, and place them in columns C1 to C5, go to: Calc > Random Data > Normal:

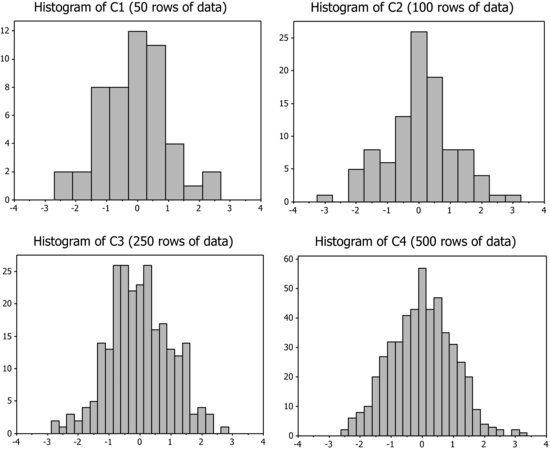
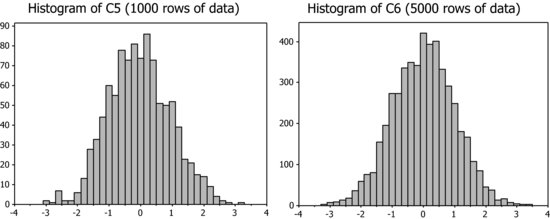
When drawing histograms with the sampled data sets, they may look as follows (notice that all histograms have been drawn with the same horizontal scale):


Get Industrial Statistics with Minitab now with the O’Reilly learning platform.
O’Reilly members experience books, live events, courses curated by job role, and more from O’Reilly and nearly 200 top publishers.

