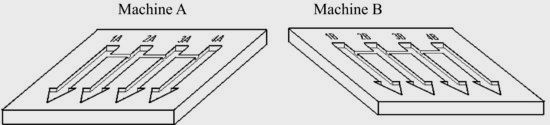
An arrow shaped plastic pieces are made with two injection moulding machines: A and B. Each machine has its own mould with 4 cavities, as shown in the following figure:
Data is available on ARROW.MTW file:
| C1
C2
C3
C4
C5 |
Defects found in the parts produced by machine A
As C1, but for machine B
Tensile strength of parts made in 15 injections with machine A (15×4 = 60 data)
As C3 for machine B
Cavity to which data from columns C3 and C4 belong. |
The questions we pose are:
1. Looking at the distribution of defects in each machine, should the improvement measures be equally prioritized for both machines?
2. As for the tensile strength, is there a difference between machines? And between cavities?
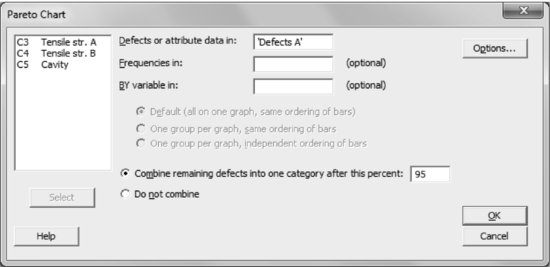
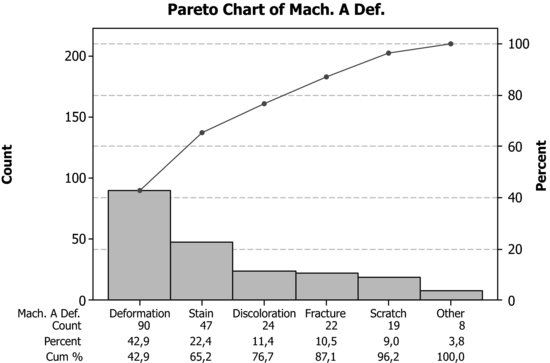
1. Let's see what is the distribution of defects in each machine by:
Stat > Quality Tools > Pareto Chart
Doing the same for the machine B:
Assuming that the data are representative of both machines, it would be appropriate to focus on the problem of deformation in machine A and scratches in machine B.
2. First of all, a graphical analysis ...