18.5 Graphs of Moving Ranges
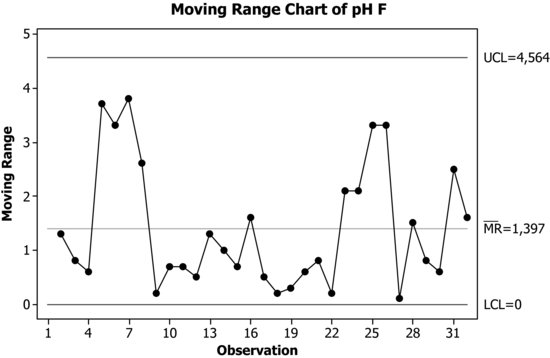
Consider again the file CLORINE.MTW and draw the graph of the moving ranges of the pH values on Friday going to the following.
Stat > Control Charts > Variables Charts for Individuals > Moving Range
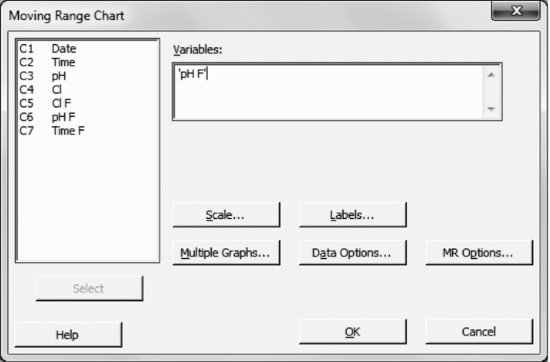
The options are basically the same as in the case of individual observations.
Get Industrial Statistics with Minitab now with the O’Reilly learning platform.
O’Reilly members experience books, live events, courses curated by job role, and more from O’Reilly and nearly 200 top publishers.

