October 2012
Beginner
420 pages
9h 37m
English
22.3 Simple Regression with ‘Fitted Line Plot’
Stat > Regression > Fitted Line Plot

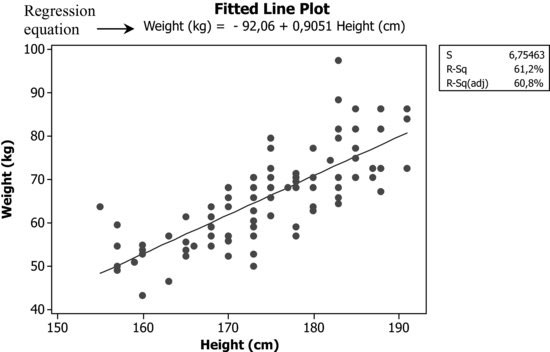
The goodness of fit indicators that appear in the upper-right box of the scatterplot are:
The session window only adds the analysis of variance table, which can be used as a significance test for the coefficient of the explanatory variable. In our example, the coefficient of the height variable is clearly significant since the p-value = 0.000.

22.3.1 Logarithmic Transformation of Data (Using ‘Options’)
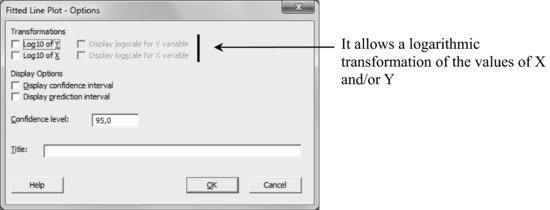
Sometimes, a much better model can be obtained using a logarithmic transformation of the values of X and/or Y. An example of a remarkable model improvement is obtained ...
Read now
Unlock full access


