24.3 Cluster Analysis for Observations
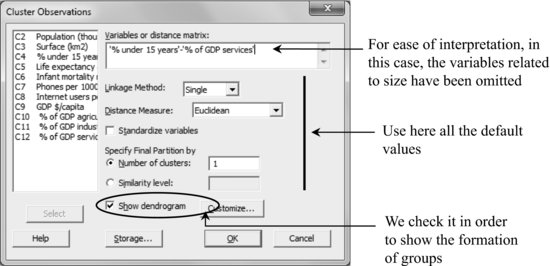
Continue working with file LATIN_AMERICA.MTW. Now, the aim is to divide the countries in groups (clusters) of similar characteristics according to the information available.
Stat > Multivariate > Cluster Observations
Take a look at the output in the Session window (blank lines have been added in order to insert comments).
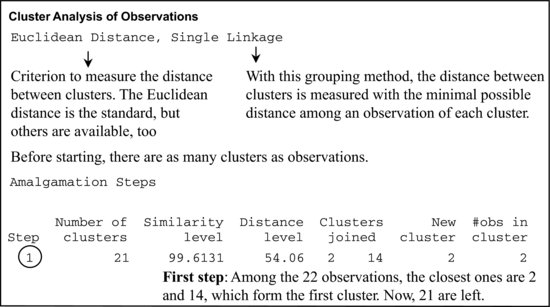
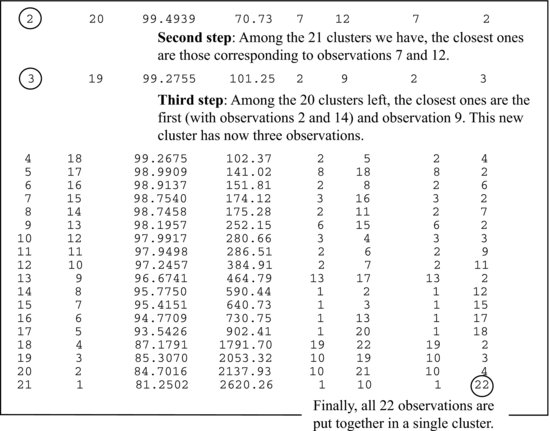
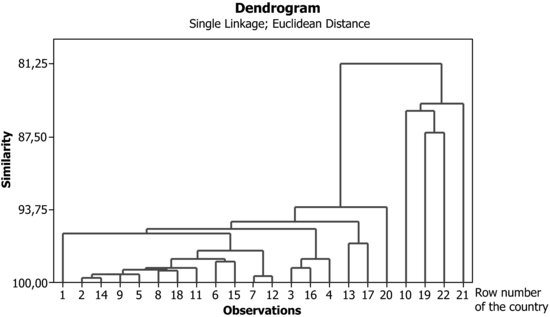
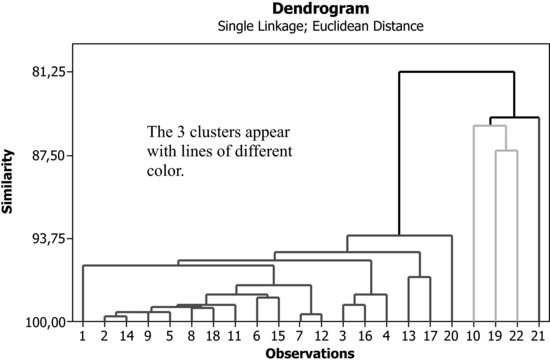
The graph shows the sequence of the clusters formation. The first one was that of observations 2 and 14 since these have the highest degree of similarity (least distance using the selected criterion). The second is the one of observations 7 and 12. The third one consists of the first cluster and observation 9, etc.
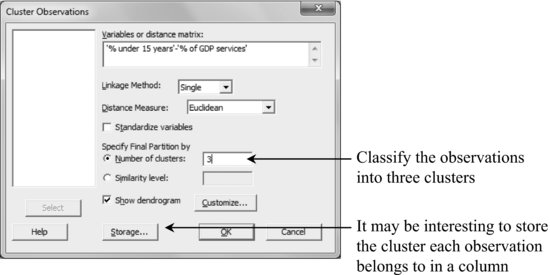
Some changes with respect to the default values:
24.3.1 Storage

Having identified to which cluster each ...
Get Industrial Statistics with Minitab now with the O’Reilly learning platform.
O’Reilly members experience books, live events, courses curated by job role, and more from O’Reilly and nearly 200 top publishers.

