Skip to Content
Industrial Statistics with Minitab
book

Industrial Statistics with Minitab

by Pere Grima Cintas, Lluis Marco Almagro, Xavier Tort-Martorell Llabres
October 2012
Beginner
420 pages
9h 37m
English
Wiley
Content preview from Industrial Statistics with Minitab

27.2 Interpretation of Results

In this example, the resulting significant effects are the main effect A (Gas Flow = 9) and the interaction AB (Gas Flow × Intensity = −6,5). Factor C (speed of the production chain) is inert.

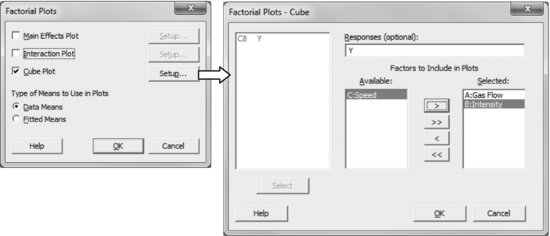
Since factors A and B interact, it is necessary to draw an interaction plot to interpret the results. To do so, choose Stat > DOE > Factorial > Factorial Plots.

Use first the option Interaction Plot.

nc27uf011.eps

Use now the option Cube Plot. The displayed dialog box looks similar to the previous one.

nc27uf012.eps
nc27uf013.eps
Minitab draws very small numbers in the plot when using Cube Plot. If you want to use this plot in reports or presentations, it is recommended that you edit it by increasing the font size.

The two interaction plots are equivalent; from one you can build the other (the following plots have been edited to increase the font size of the numbers):

nc27uf014.eps

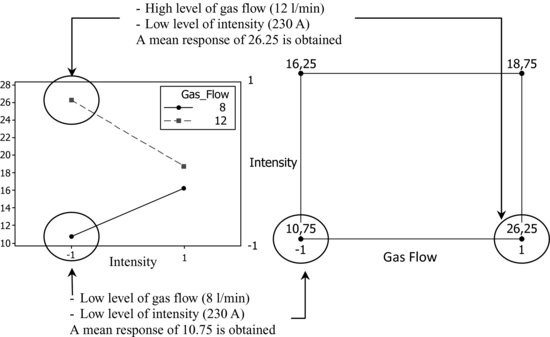
The best result is obtained with a gas flow of 12 l/min and an intensity of 230 A. Note that if you ever need, whatever the ...

Become an O’Reilly member and get unlimited access to this title plus top books and audiobooks from O’Reilly and nearly 200 top publishers, thousands of courses curated by job role, 150+ live events each month,
and much more.

Read now

Unlock full access

More than 5,000 organizations count on O’Reilly

AirBnbBlueOriginElectronic ArtsHomeDepotNasdaqRakutenTata Consultancy Services

QuotationMarkO’Reilly covers everything we've got, with content to help us build a world-class technology community, upgrade the capabilities and competencies of our teams, and improve overall team performance as well as their engagement.
Julian F.
Head of Cybersecurity
QuotationMarkI wanted to learn C and C++, but it didn't click for me until I picked up an O'Reilly book. When I went on the O’Reilly platform, I was astonished to find all the books there, plus live events and sandboxes so you could play around with the technology.
Addison B.
Field Engineer
QuotationMarkI’ve been on the O’Reilly platform for more than eight years. I use a couple of learning platforms, but I'm on O'Reilly more than anybody else. When you're there, you start learning. I'm never disappointed.
Amir M.
Data Platform Tech Lead
QuotationMarkI'm always learning. So when I got on to O'Reilly, I was like a kid in a candy store. There are playlists. There are answers. There's on-demand training. It's worth its weight in gold, in terms of what it allows me to do.
Mark W.
Embedded Software Engineer

You might also like

Statistics for Six Sigma Green Belts with Minitab and JMP

Statistics for Six Sigma Green Belts with Minitab and JMP

David M. Levine
Reliability Prediction and Testing Textbook

Reliability Prediction and Testing Textbook

Lev M. Klyatis, Edward L. Anderson
Minitab Cookbook

Minitab Cookbook

Isaac A Newton

Publisher Resources

ISBN: 9781118383780Purchase book