October 2012
Beginner
420 pages
9h 37m
English
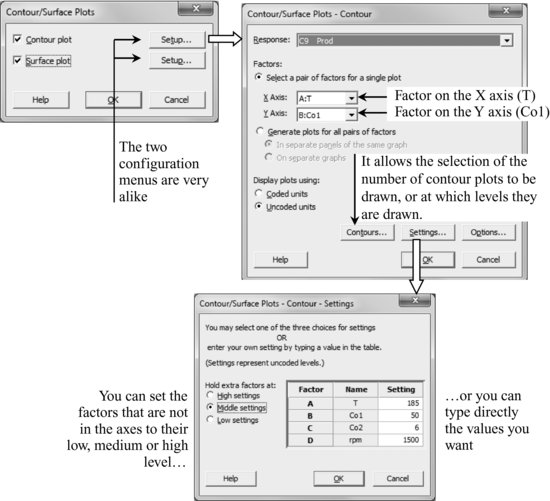
28.3 Contour Plots and Response Surface Plots
Stat > DOE > Response Surface > Contour/Surface Plots
In our example, the variables T and Co1 are used for the axes, and the variable Co2 is set to its low, medium and high values. Since the variable rpm is not involved in the model, we should not worry about it.
The following graphs show the contour plots and the response surfaces while maintaining the factor Co2 at its low, middle, and high level.

The surface ...
Read now
Unlock full access


