SELECTED BIBLIOGRAPHY
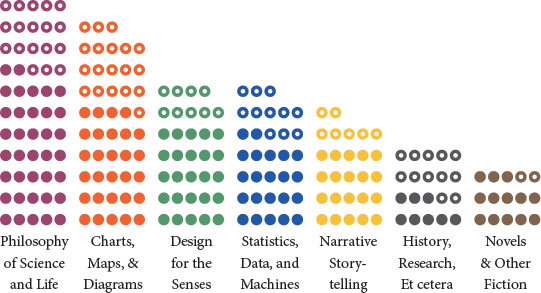
Color indicates category. Each ![]() is one book and each
is one book and each ![]() is an article or other media.
is an article or other media.
 Abbott, Edwin. Flatland: A Romance in Many Dimensions. London: Seeley & Co, 1884.
 Alexander, Christopher. The Phenomenon of Life: An Essay on the Art of Building and the Nature of the Universe. Berkeley, CA: Center for Environmental Structure, 2002.
 Alikhani, Malihe, and Matthew Stone. “Arrows Are The Verbs Of Diagrams.” Proceedings of the 27th International Conference on Computational Linguistics (2018): 3552-3563.
 Andrews, Elizabeth, message to author, Jun, 2018.
 Anscombe, FJ. “Graphs in Statistical Analysis.” The American Statistician 27, no. 1 (1973): 17-21.
- Arendt, Hannah. ...
Get Info We Trust now with the O’Reilly learning platform.
O’Reilly members experience books, live events, courses curated by job role, and more from O’Reilly and nearly 200 top publishers.

