INTERACTIVE INFOGRAPHICS
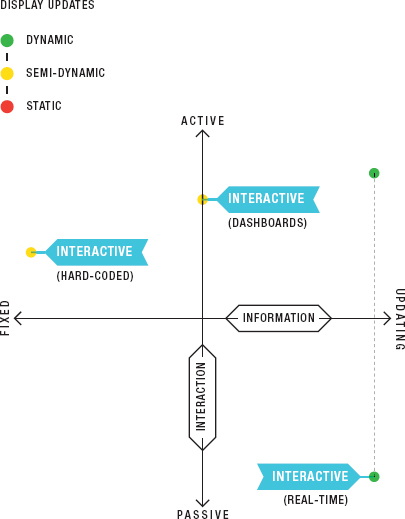
In this section, we will look at the range of interactive infographic interfaces, from the most basic functionality up to the most dynamic. This format is particularly useful if you have vast amounts of data and want to create interactive content that draws the user in to encourage further exploration. The scatterplot displays the varying degrees of user interaction (Figure 2.12). Sometimes you may want the user to browse your information in order to derive meaning that is relevant or interesting to them. Or you may use interactive infographics to guide someone through a specific narrative in a linear fashion, so they grasp the specific story that you want to tell. Keep in mind that this isn’t an either/or decision; you can use the narrative/editorial angle to tell people what you see as significant, interesting, or entertaining in order to entice them to view the content, and then encourage them to explore the data further to find information that is relevant to them.
Figure 2.12: Interactives with fixed information which require manual updates can still encourage active user interaction.

While not everything fits neatly into the categories that follow, we have found them to be helpful for segmenting projects. Additionally, they allow users to determine fairly early in the process which approach is most relevant and useful for the specific information ...
Get Infographics: The Power of Visual Storytelling now with the O’Reilly learning platform.
O’Reilly members experience books, live events, courses curated by job role, and more from O’Reilly and nearly 200 top publishers.

