Skip to Content
Interactive Data Visualization for the Web, 2nd Edition
book

Interactive Data Visualization for the Web, 2nd Edition

by Scott Murray
August 2017
Beginner to intermediate
472 pages
10h 17m
English
O'Reilly Media, Inc.
Content preview from Interactive Data Visualization for the Web, 2nd Edition

Appendix A. Case Studies

You made it to the end of the book! If you find yourself needing inspiration at any point along your D3 path, I hope you’ll explore this collection of interviews with well-established practitioners. Each one focused on a single project, presented here because it illustrates some novel or compelling use of D3. Taken together, these projects demonstrate a wide range of possibilities. The people behind them are brilliant, kind, curious, and fascinating.

“Close Votes”

dvw2 aa01
Figure A-1. The initial view of “Close Votes”

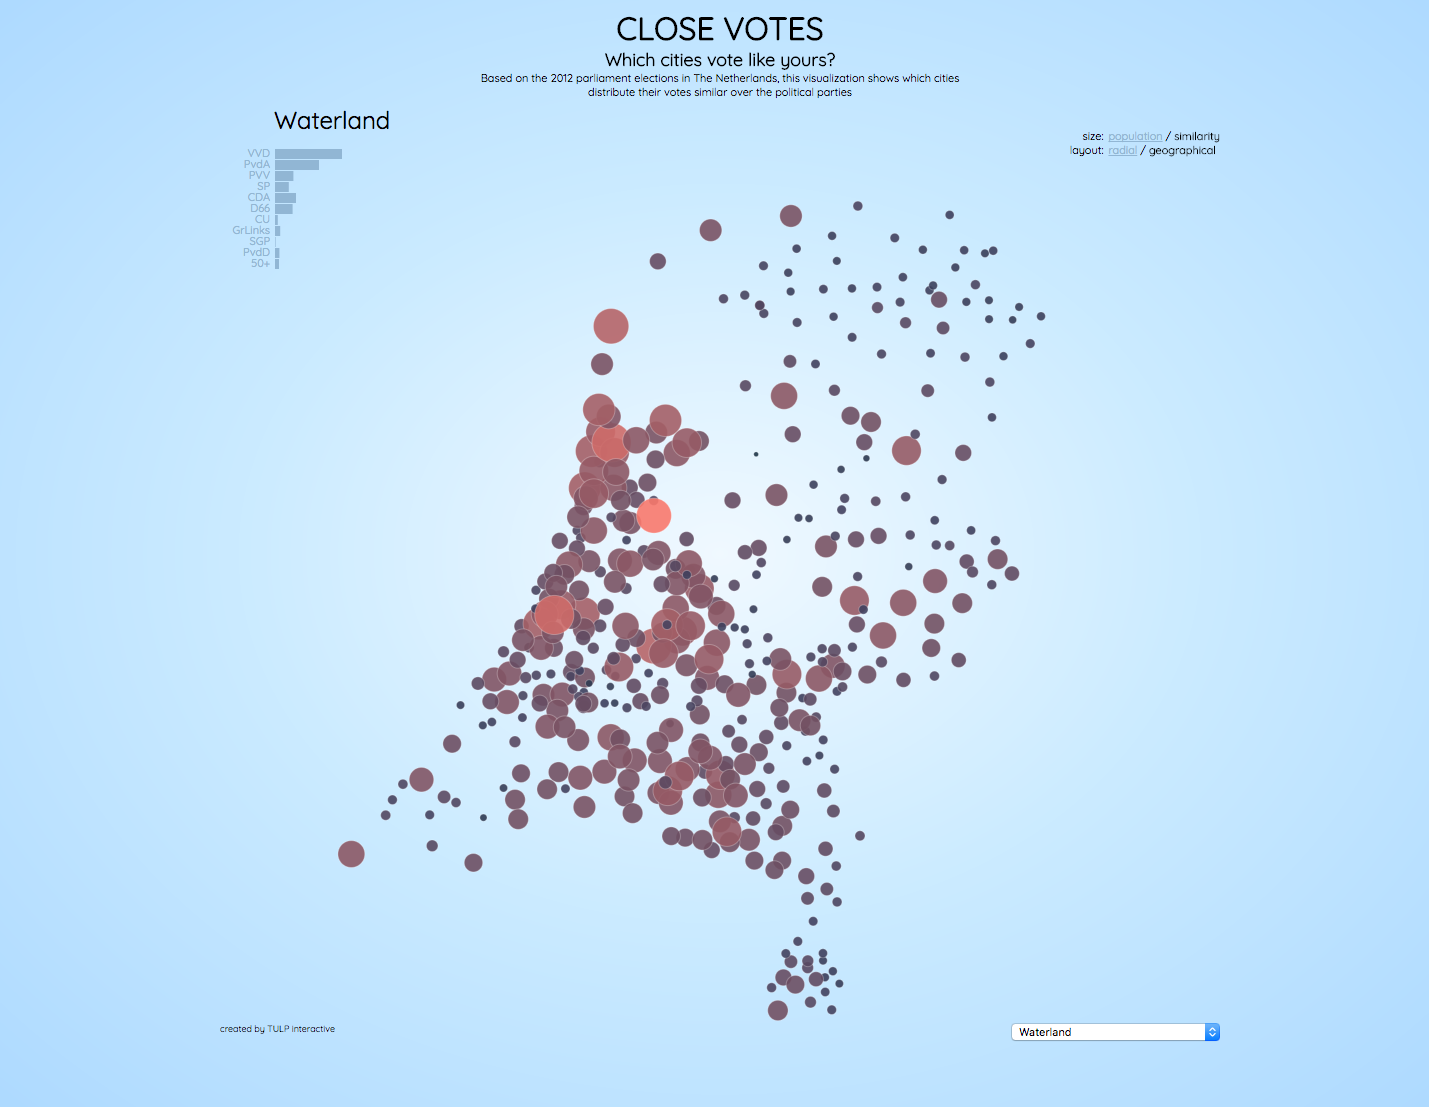
Scott: I love this project, both conceptually and aesthetically. The headline question leads viewers to explore the content through a personalized lens. You could have said “2012 Elections Results,” but instead you ask “Which cities vote like yours?” What triggered this personal project?

Jan Willem: I had the idea for this project when I was at a conference in Switzerland. Something the speaker mentioned gave me a primarily visual idea of showing election results. I don’t remember what the speaker was actually talking about, but at least it gave me an idea which I wrote down immediately, as a sketch.

But besides an idea for a visual representation, it was also just my personal interest to answer the question: “Which city votes like my city?” ...

Become an O’Reilly member and get unlimited access to this title plus top books and audiobooks from O’Reilly and nearly 200 top publishers, thousands of courses curated by job role, 150+ live events each month,
and much more.

Read now

Unlock full access

More than 5,000 organizations count on O’Reilly

AirBnbBlueOriginElectronic ArtsHomeDepotNasdaqRakutenTata Consultancy Services

QuotationMarkO’Reilly covers everything we've got, with content to help us build a world-class technology community, upgrade the capabilities and competencies of our teams, and improve overall team performance as well as their engagement.
Julian F.
Head of Cybersecurity
QuotationMarkI wanted to learn C and C++, but it didn't click for me until I picked up an O'Reilly book. When I went on the O’Reilly platform, I was astonished to find all the books there, plus live events and sandboxes so you could play around with the technology.
Addison B.
Field Engineer
QuotationMarkI’ve been on the O’Reilly platform for more than eight years. I use a couple of learning platforms, but I'm on O'Reilly more than anybody else. When you're there, you start learning. I'm never disappointed.
Amir M.
Data Platform Tech Lead
QuotationMarkI'm always learning. So when I got on to O'Reilly, I was like a kid in a candy store. There are playlists. There are answers. There's on-demand training. It's worth its weight in gold, in terms of what it allows me to do.
Mark W.
Embedded Software Engineer

You might also like

Storytelling with Data: A Data Visualization Guide for Business Professionals

Storytelling with Data: A Data Visualization Guide for Business Professionals

Cole Nussbaumer Knaflic

Publisher Resources

ISBN: 9781491921296Errata Page