C.11 Examples for Chapter 21
Example 40
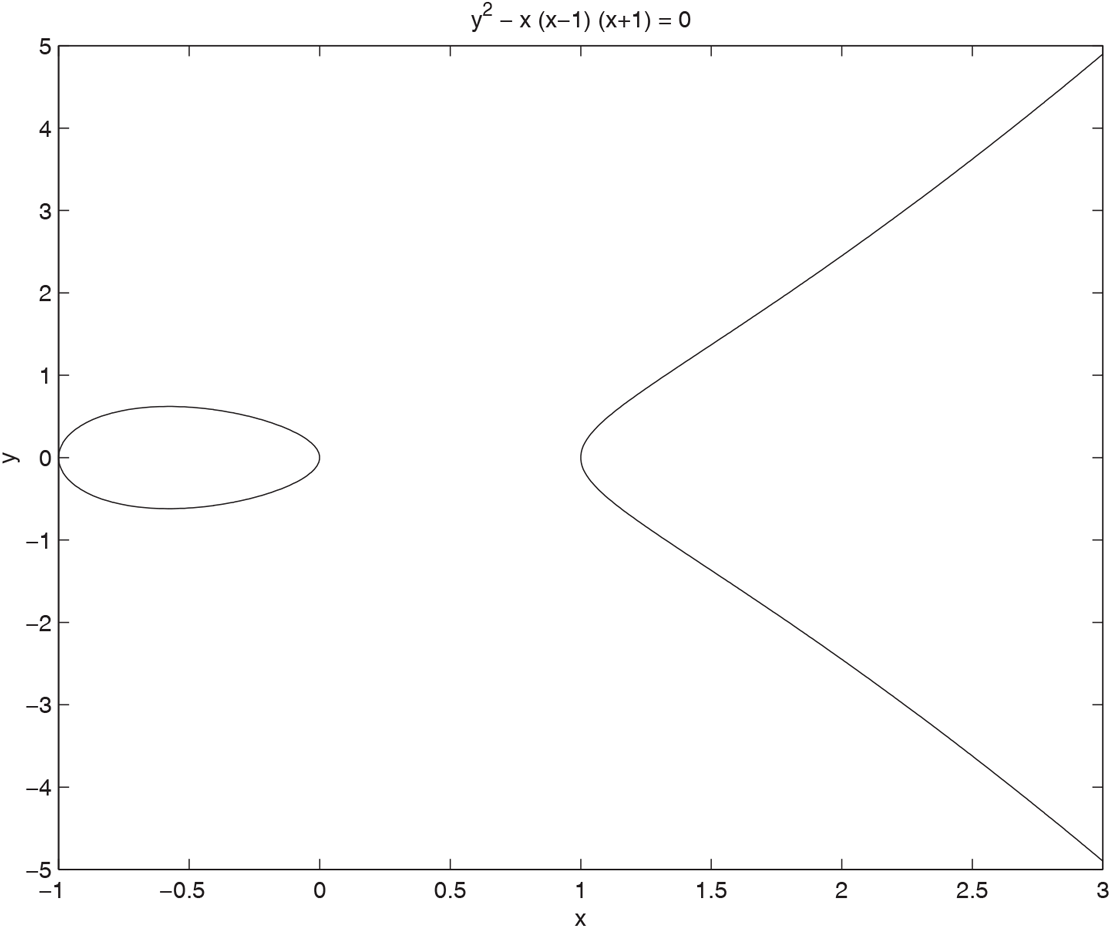
We want to graph the elliptic curve .
First, we create a string that contains the equation we wish to graph.
>> v=’y^2 - x*(x-1)*(x+1)’;Next we use the ezplot command to plot the elliptic curve.
>> ezplot(v,[-1,3,-5,5])The plot appears in Figure C.1. The use of in the preceding command is to define the limits of the -axis and -axis in the plot.
Figure C.1 Graph of the Elliptic Curve .
Example 41
Add the points (1,3) and (3,5) on the elliptic curve .
>> addell([1,3],[3,5],24,13,29)ans =26 1
You can ...
Get Introduction to Cryptography with Coding Theory, 3rd Edition now with the O’Reilly learning platform.
O’Reilly members experience books, live events, courses curated by job role, and more from O’Reilly and nearly 200 top publishers.

