Chapter 4Misuse of Statistics and Other Controversial Practices
The Deception of Average
The “World of Finance” is fraught with misleading information. The use of average is one that needs a discussion. Figure 4.1 shows the compounded rates of return for a variety of asset classes. If I were selling you a buy-and-hold strategy, or an index fund, I would love this chart. From this chart showing 85 years of data, I could say that if you had invested in small cap stocks you would have averaged 11.95 percent a year, and if you had invested in large cap stocks you would have averaged 9.85 percent a year. And I would be correct.
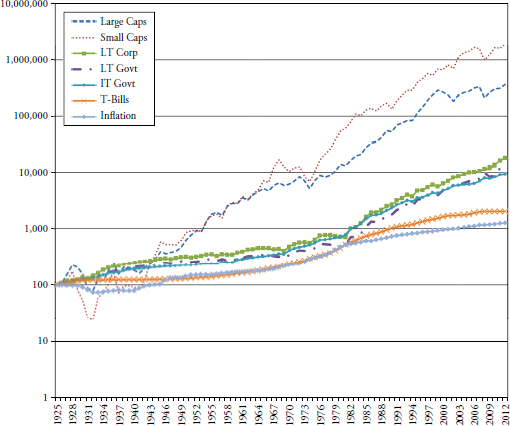
FIGURE 4.1 Eighty-Five-Year Returns of Various Assets
I think that most investors have about 20 years, maybe 25 years, in which to accumulate their retirement wealth. In their 20s and 30s, it is difficult to put much money away for many reasons such as: low incomes, children, materialism, college, and so on. Therefore, with that information, what is wrong with this chart? It is for an 85-year investment and people do not have 85 years to invest. As said earlier, most have about 20 years to acquire their retirement wealth and there are many 20-year periods in this chart where the returns were horrible. The bear market that began in 1929 did not fully recover until 1954, a full 25 years later; 1966 took 16 years to recover, 1973 took 10 years, and today’s ...
Get Investing with the Trend: A Rules-based Approach to Money Management now with the O’Reilly learning platform.
O’Reilly members experience books, live events, courses curated by job role, and more from O’Reilly and nearly 200 top publishers.

