The Gaussian Copula
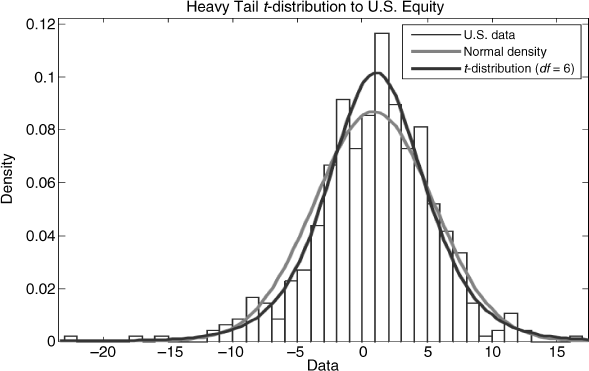
The idea of studying portfolio risk in a world in which returns may follow different distributions, perhaps depending on the asset class, is an intriguing one. After all, there is ample evidence to suggest that returns, in general, are not well modeled by the normal density (fat tails, excess kurtosis, negative or positive skew, and so forth). The following example shows the empirical distribution of U.S. equity returns over the period 1970 to 2009 fit to both the normal and t-distribution with six degrees of freedom. The t-distribution maximizes the likelihood of the observed data. Notice that while the normal density would tend to overestimate mid-range losses, it also tends to underestimate tail losses and that there is also an asymmetry embodied in the lower tail of the distribution of returns. Chapter 13 models the distribution of the tail directly, using extreme value theory.
Therefore, while we may reject normality in favor of an alternative distributional assumption, these alternatives are generally the result of empirical models fit to specific return streams using maximum likelihood methods, which would suggest that return distributions will vary across asset classes. High yield credit, for example, is likely to have fatter tails than investment grade bonds, and bond returns, in general, will behave differently from equity returns. Moreover, it is also ...
Get Investment Theory and Risk Management, + Website now with the O’Reilly learning platform.
O’Reilly members experience books, live events, courses curated by job role, and more from O’Reilly and nearly 200 top publishers.

