Plotting a bar chart
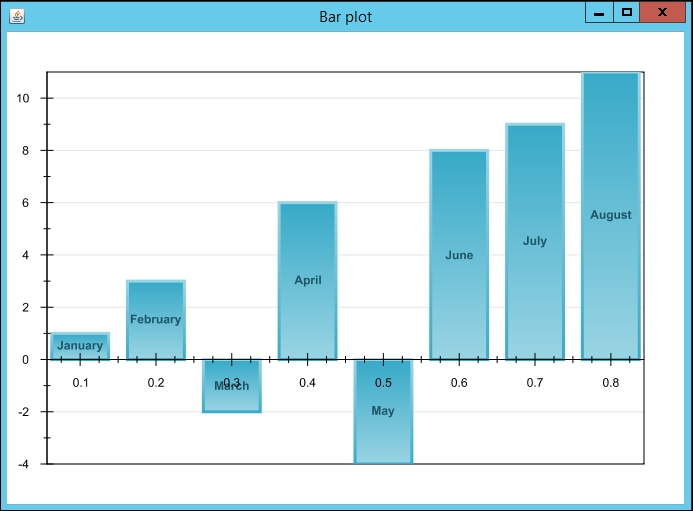
Bar plots are the most common graph types used by data scientists. It is simple to draw a bar chart using GRAL. In this recipe, we will be using GRAL to plot the following bar chart:
Getting ready
- To use GRAL to plot bar charts, we need the example applications provided with the library in the form of Jar files. These example applications can be downloaded from http://trac.erichseifert.de/gral/wiki/Download. Download the
gral-examples-0.10.zipfile from the download location into your local disk. Extract the files. - Once you download the ZIP files, and extract them, you will see a directory structure as shown in the Getting ready ...
Get Java Data Science Cookbook now with the O’Reilly learning platform.
O’Reilly members experience books, live events, courses curated by job role, and more from O’Reilly and nearly 200 top publishers.

