Contents
Preparing the Data for Diagramming
To produce the diagram, begin with data in two columns of a data table.
Figure 12.2 Ishikawa Diagram

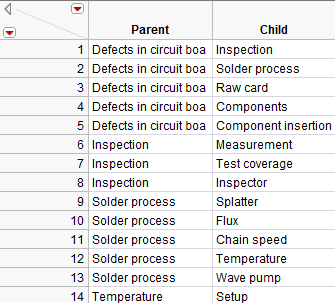
Some sample data (Montgomery, 1996) is shown in Figure 12.3, from the Ishikawa.jmp sample data table.
Figure 12.3 A Portion of the Ishikawa Sample Data

Notice that the Parent value “Defects in circuit board” (rows 1–5) has many causes, listed in the Child ...
Get JMP 10 Quality and Reliability Methods now with the O’Reilly learning platform.
O’Reilly members experience books, live events, courses curated by job role, and more from O’Reilly and nearly 200 top publishers.

