Contour Profiler Overview
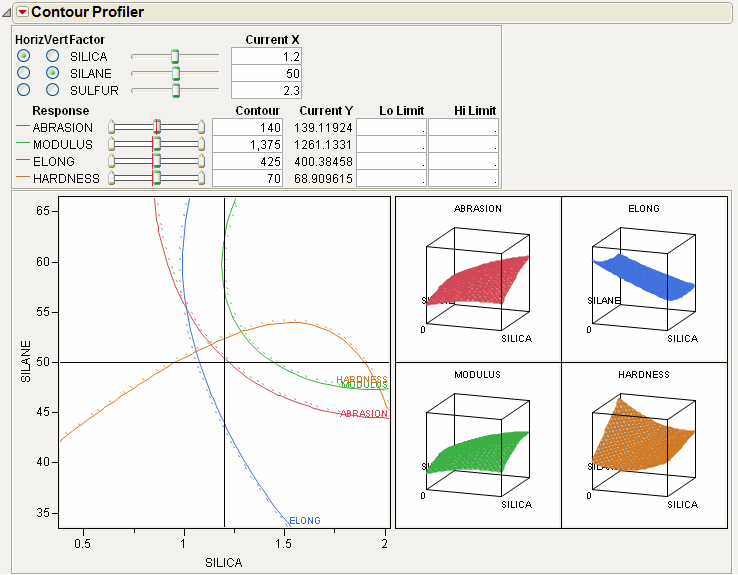
The Contour Profiler shows response contours for two factors at a time. The interactive contour profiling facility is useful for optimizing response surfaces graphically. Figure 4.2 shows an example of the Contour Profiler for the Tiretread sample data.
Figure 4.2 Contour Profiler

• There are slider controls and edit fields for both the X and Y variables.
• The Current X values generate the Current Y values. The Current X location is shown by the crosshair lines on the graph. The Current Y values are shown by the small red lines in the slider control.
• The other lines on the graph are the contours for the responses ...
Get JMP 11 Profilers now with the O’Reilly learning platform.
O’Reilly members experience books, live events, courses curated by job role, and more from O’Reilly and nearly 200 top publishers.

