Example of Treemaps
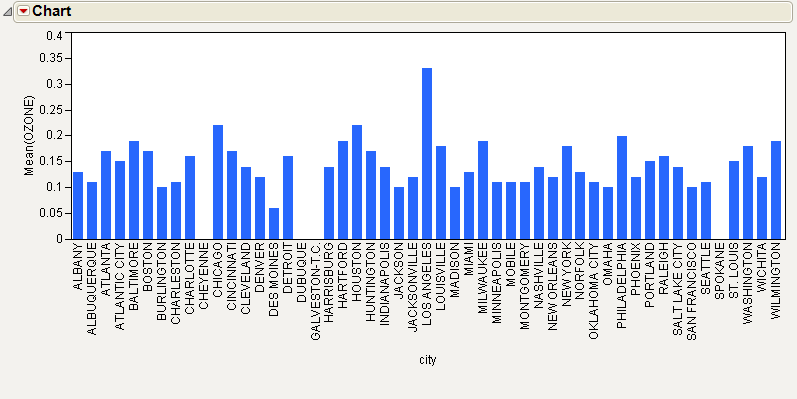
Treemaps can be useful in cases where histograms or bar charts are ineffective. This example uses the Cities.jmp sample data table, which contains meteorological and demographic statistics for 52 cities. Compare the bar chart to the treemap.
Create a bar chart representing ozone levels in each of the 52 cities:
1. Select Help > Sample Data Library and open Cities.jmp.
2. Select Graph > Chart.
The launch window appears.
3. Select OZONE and click Statistics.
4. Select Mean.
5. Select city and click Categories, X, Levels.
6. Click OK.
The report window appears.
Figure 10.2 Ozone Levels in a Bar Chart

Although it is easy to see ...
Get JMP 12 Essential Graphing now with the O’Reilly learning platform.
O’Reilly members experience books, live events, courses curated by job role, and more from O’Reilly and nearly 200 top publishers.

