Example of the Chart Platform
Here is a simple example that shows how to plot the mean height of students based on their age group.
1. Select Help > Sample Data Library and open Students.jmp.
2. Select Graph > Chart.
3. Select height and click Statistics.
4. Select Mean from the menu of statistics.
5. Select age and click Categories, X, Levels.
Figure 14.2 The Completed Chart Launch Window
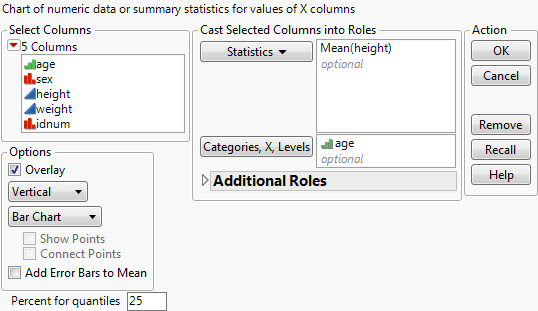
6. Click OK.
Figure 14.3 Mean of height by age
This bar chart shows the following:
• The mean height of the students in this class increases with age.
•
Get JMP 13 Essential Graphing now with the O’Reilly learning platform.
O’Reilly members experience books, live events, courses curated by job role, and more from O’Reilly and nearly 200 top publishers.

