Chapter 7
Contour Plots
View Multidimensional Relationships in Two Dimensions
The Contour Plot command in the Graph menu constructs contours of a response in a rectangular coordinate system. A contour plot shows a three-dimensional surface in two dimensions. Contours delineate changes in the third dimension.
Here are some of the options available with the Contour platform:
⢠specify the number of contour levels
⢠choose to plot contour lines or filled contours
⢠show or hide data points
⢠label contours with response values
⢠define and use a custom coloring scheme
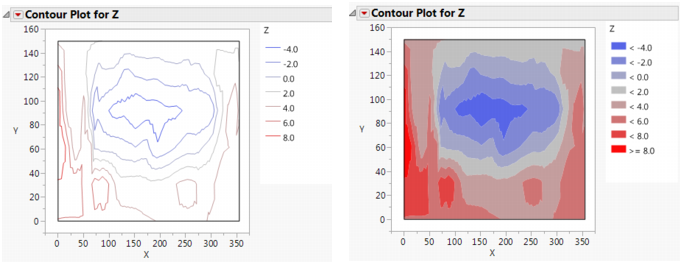
Figure 7.1 Examples of Contour Plots
Get JMP 13 Essential Graphing now with the O’Reilly learning platform.
O’Reilly members experience books, live events, courses curated by job role, and more from O’Reilly and nearly 200 top publishers.

